December 08, 2025 a 02:46 am

LNT: Dividend Analysis - Alliant Energy Corporation
Alliant Energy Corporation presents a solid investment opportunity with a sustainable dividend yield and a consistent history of dividend payouts. Over nearly four decades, the company has demonstrated resilience and a commitment to returning value to shareholders, making it a stable choice for dividend-focused portfolios. Despite its slightly high payout ratios when based on free cash flow, the company's established growth trends suggest a potential for modest and sustained dividend increases.
📊 Overview
This section focuses on the key metrics that define Alliant Energy Corporation’s dividend profile.
| Metric | Value |
|---|---|
| Sector | Utilities |
| Dividend yield | 3.04 % |
| Current dividend per share | 1.92 USD |
| Dividend history | 39 years |
| Last cut or suspension | 2013 |
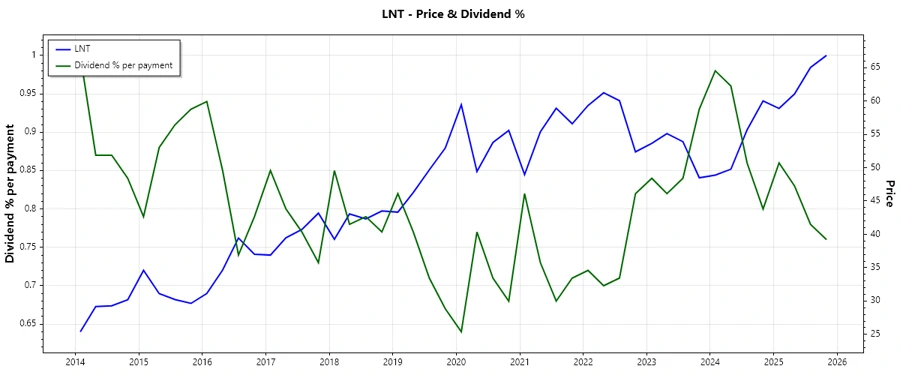
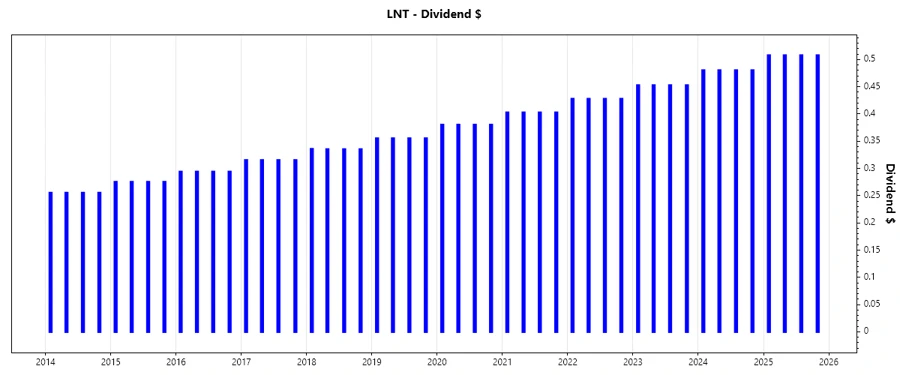
📈 Dividend History
The historical data illustrates Alliant Energy's robust commitment to maintaining dividend payments, reflecting its financial health and shareholder value focus.
| Year | Dividend Per Share (USD) |
|---|---|
| 2025 | 2.0300 |
| 2024 | 1.92 |
| 2023 | 1.8100 |
| 2022 | 1.7100 |
| 2021 | 1.6100 |
📈 Dividend Growth
Evaluating the growth in dividends over multiple years highlights the company’s dividend strength and potential future income growth for investors.
| Time | Growth |
|---|---|
| 3 years | 6.05 % |
| 5 years | 6.22 % |
The average dividend growth is 6.22 % over 5 years. This shows moderate but steady dividend growth.
📉 Payout Ratio
Payout ratios provide insight into the sustainability of the dividend payments relative to the company’s earnings and cash flow positions.
| Key figure | Ratio |
|---|---|
| EPS-based | 61.62 % |
| Free cash flow-based | 145.45 % |
While the EPS payout ratio is reasonable, the FCF-based ratio suggests a potential strain on cash flow if operating conditions become unfavorable.
💼 Cashflow & Capital Efficiency
An analysis of cash flows relative to capital expenditure can reveal how efficiently a company reinvests cash flow in future growth opportunities.
| Metric | 2024 | 2023 | 2022 |
|---|---|---|---|
| Free Cash Flow Yield | -7.13 % | -7.60 % | -7.20 % |
| Earnings Yield | 4.55 % | 5.42 % | 4.95 % |
| CAPEX to Operating Cash Flow | 1.93 | 2.14 | 3.05 |
| Stock-based Compensation to Revenue | 0 | 0 | 0 |
| Free Cash Flow / Operating Cash Flow Ratio | -92.72 % | -113.84 % | -205.35 % |
The low free cash flow yield and negative ratios suggest challenges in cash flow stemming from high capital expenditures, impacting free cash flow stability.
🏦 Balance Sheet & Leverage Analysis
This analysis assesses financial stability by examining the company’s leverage relative to its earnings capabilities and asset base.
| Metric | 2024 | 2023 | 2022 |
|---|---|---|---|
| Debt-to-Equity | 1.49 | 1.40 | 1.39 |
| Debt-to-Assets | 0.46 | 0.45 | 0.43 |
| Debt-to-Capital | 0.60 | 0.58 | 0.58 |
| Net Debt to EBITDA | 5.75 | 5.32 | 5.15 |
| Current Ratio | 0.44 | 0.55 | 0.53 |
| Quick Ratio | 0.33 | 0.40 | 0.39 |
| Financial Leverage | 3.24 | 3.13 | 3.21 |
High leverage ratios may pose risks under economic pressures, necessitating close monitoring of debt management strategies to ensure liquidity.
📊 Fundamental Strength & Profitability
This section offers insights into the company’s overall financial strength through profitability measures and return metrics.
| Metric | 2024 | 2023 | 2022 |
|---|---|---|---|
| Return on Equity | 9.85 % | 10.37 % | 10.93 % |
| Return on Assets | 3.04 % | 3.31 % | 3.40 % |
| Margins: Net | 17.33 % | 17.46 % | 16.31 % |
| Margins: EBIT | 25.75 % | 27.34 % | 24.19 % |
| Margins: EBITDA | 45.13 % | 44.13 % | 40.14 % |
| Margins: Gross | 44.71 % | 43.06 % | 40.64 % |
| Research & Development to Revenue | 0 | 0 | 0 |
The metrics underscore robust profitability, showcasing Alliant Energy’s strong capability in generating returns on equity and assets.
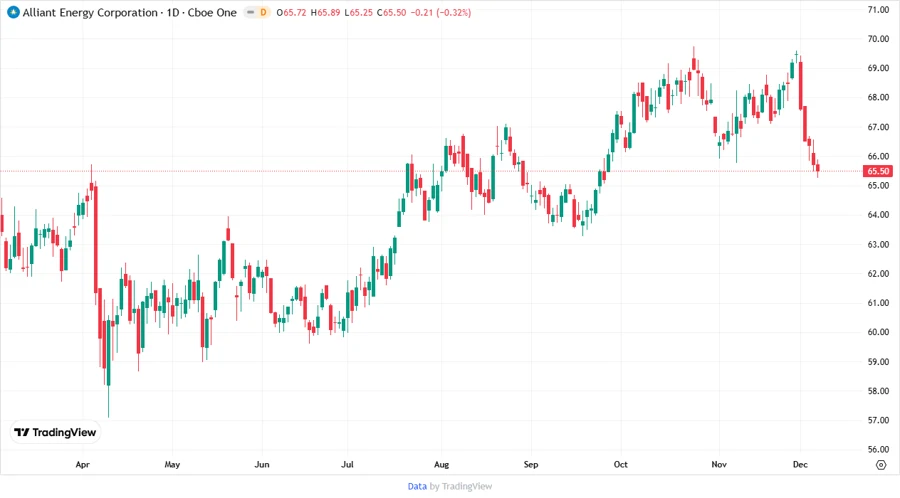
📷 Price Development
✅ Dividend Scoring System
| Criteria | Score | Visual Score |
|---|---|---|
| Dividend yield | 4 | |
| Dividend Stability | 5 | |
| Dividend growth | 3 | |
| Payout ratio | 3 | |
| Financial stability | 3 | |
| Dividend continuity | 5 | |
| Cashflow Coverage | 2 | |
| Balance Sheet Quality | 3 |
Total Score: 28/40
🌟 Rating
Alliant Energy Corporation presents a compelling investment opportunity for investors seeking a stable, dividend-focused stock. The company's consistent dividend history, along with a track record of modest growth, offsets some concerns over its leverage and cash flow strains. This stock would perform well in a dividend-oriented portfolio but requires vigilance regarding financial and cash flow stability.