September 27, 2025 a 07:47 am
LNT: Dividend Analysis - Alliant Energy Corporation
Alliant Energy Corporation's dividend profile exudes stability and consistency, underlined by its 39-year history of dividend payments without a recent cut or suspension. The company's dividend yield of 3.08% presents a moderate return for income-focused investors.
📊 Overview
Alliant Energy operates within a stable sector, providing reliable dividend returns. Its long-standing history of dividend payments underscores a strong commitment to shareholders.
| Key Metrics | Value |
|---|---|
| Sector | Utilities |
| Dividend yield | 3.08 % |
| Current dividend per share | 1.92 USD |
| Dividend history | 39 years |
| Last cut or suspension | None |
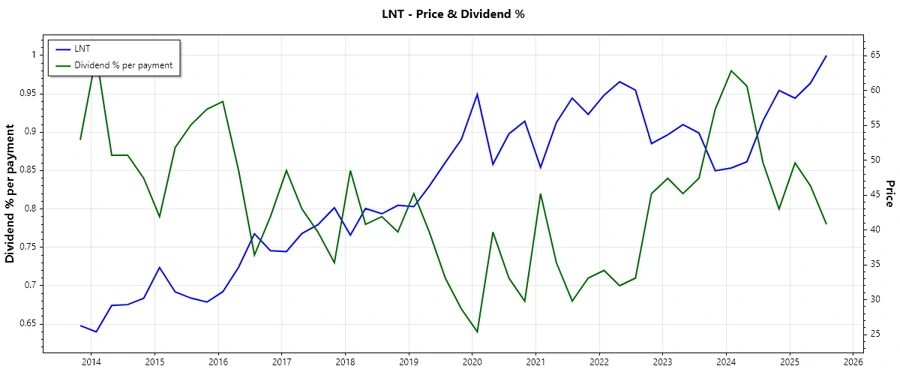
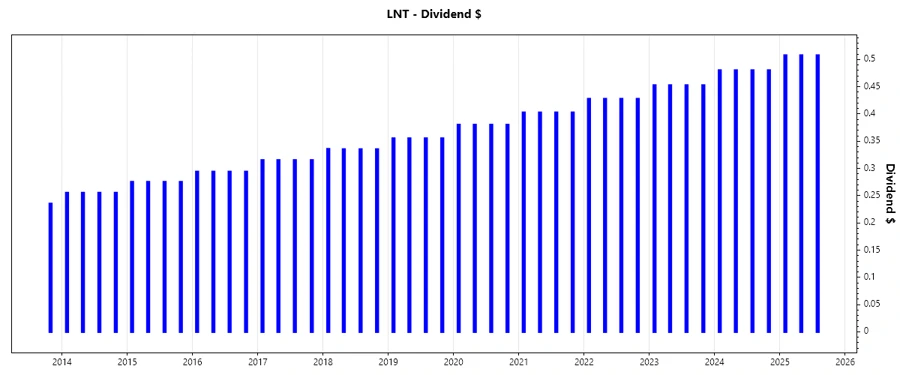
📉 Dividend History
Analyzing Alliant Energy's dividend history, it's evident the company values steadiness, having maintained or increased its payouts for nearly four decades. This attribute is critical for investors seeking income stability.
| Year | Dividend Per Share (USD) |
|---|---|
| 2025 | 1.52 |
| 2024 | 1.92 |
| 2023 | 1.81 |
| 2022 | 1.71 |
| 2021 | 1.61 |
📈 Dividend Growth
Alliant Energy's dividend growth is modest yet reassuring, fitting well with a conservative investment strategy. The growth rate cushions against inflation and supports income enhancement over the long term.
| Time | Growth |
|---|---|
| 3 years | 6.05 % |
| 5 years | 6.22 % |
The average dividend growth is 6.22 % over 5 years. This shows moderate but steady dividend growth.
🗣️ Payout Ratio
The payout ratios reflect Alliant Energy's capacity to support its dividends through earnings and cash flows, with a balanced EPS-based payout ratio of 59.22%, ensuring sustainability.
| Key Figure | Ratio |
|---|---|
| EPS-based | 59.22 % |
| Free cash flow-based | -39.21 % |
The EPS-based payout is healthy, denoting a safe dividend, while the negative FCF ratio requires efficiency improvements for better sustainability.
✅ Cashflow & Capital Efficiency
Alliant Energy's cash flow profile presents challenges, with negative free cash flow yield impacts due to significant CAPEX. However, earnings yield suggests room to leverage higher efficiencies.
| 2022 | 2023 | 2024 | |
|---|---|---|---|
| Free Cash Flow Yield | -0.07 | -0.08 | -0.07 |
| Earnings Yield | 0.05 | 0.05 | 0.05 |
| CAPEX to Operating Cash Flow | 2.05 | 2.14 | 1.93 |
| Stock-based Compensation to Revenue | 0.00 | 0.00 | 0.00 |
| Free Cash Flow / Operating Cash Flow Ratio | -2.05 | -1.14 | -0.93 |
The data reflects a need for Alliant Energy to enhance its capital and operational efficiencies to bolster cash flow stability.
⚠️ Balance Sheet & Leverage Analysis
Alliant Energy's balance sheet reveals moderate leverage, with a debt-to-equity ratio indicating significant reliance on debt. Ensuring adequate liquidity while balancing obligations is crucial.
| 2022 | 2023 | 2024 | |
|---|---|---|---|
| Debt-to-Equity | 1.39 | 1.40 | 1.49 |
| Debt-to-Assets | 0.43 | 0.45 | 0.46 |
| Debt-to-Capital | 0.58 | 0.58 | 0.60 |
| Net Debt to EBITDA | 5.15 | 5.32 | 5.75 |
| Current Ratio | 0.53 | 0.55 | 0.44 |
| Quick Ratio | 0.39 | 0.40 | 0.33 |
| Financial Leverage | 3.21 | 3.13 | 3.24 |
The company's balance sheet suggests a strategic task in enhancing liquidity and managing leverage effectively.
📊 Fundamental Strength & Profitability
Alliant Energy showcases solid profitability metrics, a significant factor in driving long-term shareholder value.
| 2022 | 2023 | 2024 | |
|---|---|---|---|
| Return on Equity | 10.93% | 10.37% | 9.85% |
| Return on Assets | 3.40% | 3.31% | 3.04% |
| Net Margin | 16.31% | 17.45% | 17.33% |
| EBIT Margin | 24.19% | 27.34% | 25.75% |
| EBITDA Margin | 40.14% | 44.13% | 45.14% |
| Gross Margin | 40.64% | 43.06% | 44.71% |
| Research & Development to Revenue | 0.00% | 0.00% | 0.00% |
Overall, Alliant Energy's profitability dyes a strong narrative and supports its ability to enhance shareholder value consistently.
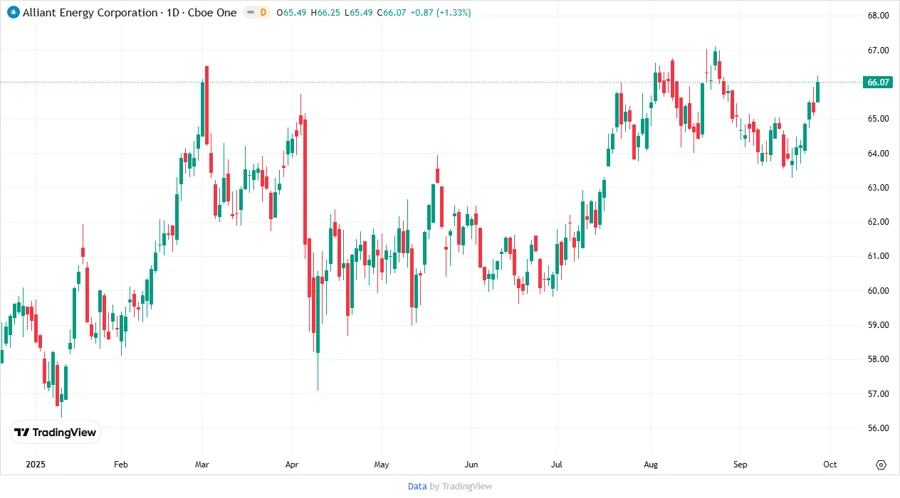
📈 Price Development
📊 Dividend Scoring System
| Criteria | Score | Score Bar |
|---|---|---|
| Dividend yield | 4 | |
| Dividend Stability | 5 | |
| Dividend growth | 3 | |
| Payout ratio | 4 | |
| Financial stability | 3 | |
| Dividend continuity | 5 | |
| Cashflow Coverage | 2 | |
| Balance Sheet Quality | 3 |
Total Score: 29/40
Rating
Alliant Energy Corporation's dividend profile is robust, with impressive stability and solid historical growth. However, constraints in cash flow coverage indicate areas for improvement in operational efficiency. This analysis suggests the stock is a good investment for income-focused investors seeking reliable yield with moderate growth prospects.
Smart Data Insight
Master the Perfect Entry & Exit for this Stock
Don't leave your profits to chance. Historically, this stock follows specific seasonal patterns that institutional traders use to maximize returns.
- ✅ Identify the "Golden Buying Window"
- ✅ Avoid high-risk correction cycles
- ✅ Backtested data from the last 20+ years