April 22, 2026 a 08:15 am

LLY: Trend and Support & Resistance Analysis - Eli Lilly and Company
Eli Lilly and Company (Ticker: LLY), a leader in pharmaceuticals, has shown dynamic movement in its stock prices despite market volatility. Their extensive portfolio and strong R&D position them favorably, though their stock carries risk from regulatory and competitive pressures. Recent data indicates significant movement patterns that suggest a potential opportunity for traders. Understanding these trends can provide a strategic advantage for investments.
Trend Analysis
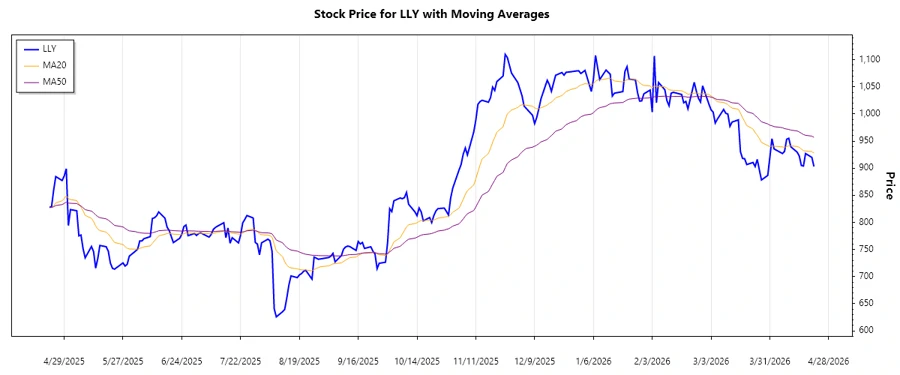
The recent analysis based on the closing prices of Eli Lilly (LLY) stock reveals mixed trends over the past months. Using the EMA (Exponential Moving Average) to assess the trend, we calculated the EMA20 and EMA50.
| Date | Closing Price | Trend |
|---|---|---|
| 2026-04-21 | $903.02 | ▼ Abwärtstrend |
| 2026-04-20 | $919.90 | ▼ Abwärtstrend |
| 2026-04-17 | $927.03 | ▲ Aufwärtstrend |
| 2026-04-16 | $903.99 | ▼ Abwärtstrend |
| 2026-04-15 | $905.03 | ▼ Abwärtstrend |
| 2026-04-14 | $922.50 | ▲ Aufwärtstrend |
| 2026-04-13 | $929.55 | ▲ Aufwärtstrend |
The calculated EMA20 was slightly above the EMA50, suggesting a mild uptrend initially, but fluctuations led to a primarily sideways movement. Technical indicators denote a mixed market sentiment reflected in recent volatility.
Support and Resistance
The support and resistance levels derived from recent price data are crucial for determining resistance breakouts or potential support rebounds. The key support and resistance levels are as follows:
| Zone Type | From | To |
|---|---|---|
| Support Zone 1 | $900 | $910 |
| Support Zone 2 | $870 | $880 |
| Resistance Zone 1 | $950 | $960 |
| Resistance Zone 2 | $930 | $940 |
The current price action positions the stock near a resistance zone, suggesting caution as resistance has been tested previously. A breakout past the resistance may indicate further upside potential.
Conclusion
Eli Lilly (LLY) stock trends indicate cautious optimism, given the mixed signals from recent EMAs pointing toward a potential sideways trend interrupted by volatility. Opportunities exist if positioned correctly within identified support and resistance zones; however, the stock remains vulnerable to external market pressures. Long-term growth potential aligns with the company's strong pharmaceutical portfolio, though investors should remain aware of short-term fluctuations. Strategic entries around support can maximize potential upside, while caution is advised approaching resistance levels.