April 21, 2026 a 05:15 am
LLY: Fibonacci Analysis - Eli Lilly and Company
Eli Lilly and Company has shown a significant downtrend over the past months. The stock's volatility, influenced by broader market conditions and sector-specific challenges, has posed both opportunities and risks for investors. This analysis seeks to provide insights into key price levels derived from the recent bearish trend and the potential areas of price stabilization or further decline.
Fibonacci Analysis
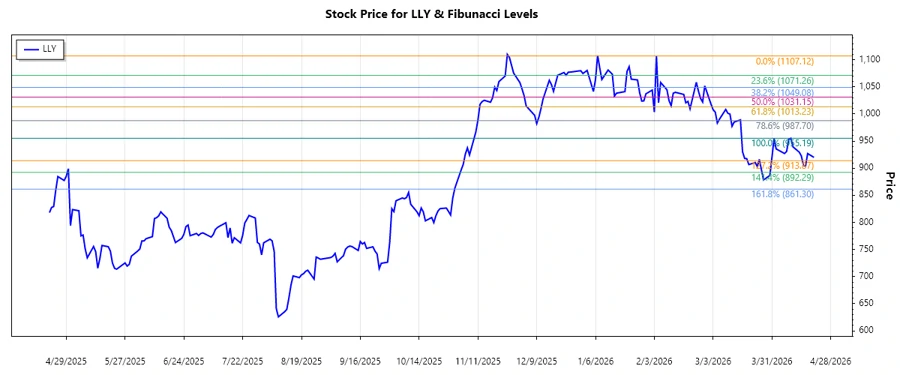
The historic price data for Eli Lilly (LLY) over the recent months reveal a dominant downtrend that commenced on January 5, 2026, with a noteworthy high of $1107.12, and culminated on April 9, 2026, at a low of $955.19. Based on this price movement, Fibonacci Retracement levels can provide potential price targets and areas of support or resistance.
| Trend Analysis | |
|---|---|
| Start Date | 2026-01-05 |
| End Date | 2026-04-09 |
| High Price (Date) | $1107.12 (2026-02-04) |
| Low Price (Date) | $955.19 (2026-04-09) |
| Fibonacci Level | Price Target |
|---|---|
| 0.236 | $992.02 |
| 0.382 | $1020.84 |
| 0.5 | $1031.16 |
| 0.618 | $1041.47 |
| 0.786 | $1059.24 |
As of the current analysis, the latest closing price stands at $927.03, placing the stock outside of the immediate Fibonacci retracement zones calculated above.
The current price does not lie within any retracement zone, indicating a potential lack of immediate support or resistance as indicated by the Fibonacci levels. Continuous monitoring of price movement is advised to ascertain entry or exit points, especially around calculated key levels.
Conclusion
The trend for Eli Lilly is currently bearish, reflecting broader economic challenges and investor sentiment. The analysis indicates no immediate Fibonacci Retracement support, suggesting potential further downtrend. However, each retracement level, particularly the 0.236 and 0.382 levels, should be monitored for any reversal signals providing buying opportunities. Risks include sector-specific downturns and broader market declines, whereas opportunities may arise from strong support levels or favorable business developments.