February 12, 2026 a 12:46 pm
LLY: Dividend Analysis - Eli Lilly and Company
Eli Lilly and Company presents a robust dividend profile with a legacy of consistent payments, boasting 55 years of dividend history underlining its reliability. The dividend growth over the past 5 years signifies steady progress, yet the relatively modest current dividend yield may not appeal to income-focused investors. Analysts should also note the robust payout ratios, which highlight a well-supported dividend policy. Lilly's strategic financial management balances growth and shareholder returns.
📊 Overview
The following provides an extensive overview of Eli Lilly's dividend metrics:
| Metric | Detail |
|---|---|
| Sector | Pharmaceuticals |
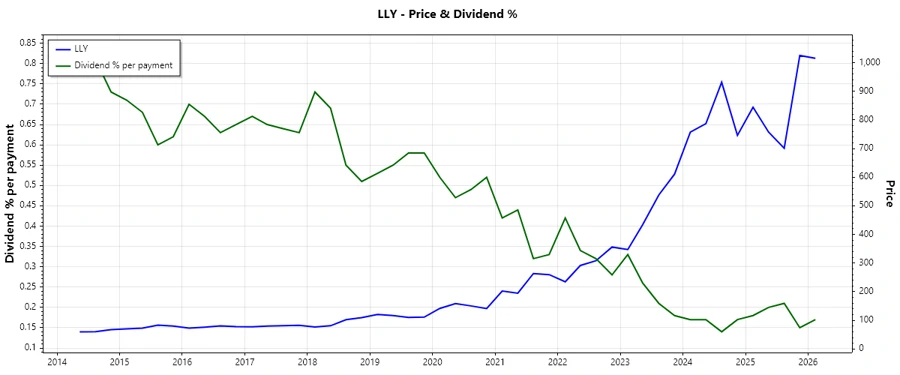
| Dividend yield | 0.61% |
| Current dividend per share | 6 USD |
| Dividend history | 55 years |
| Last cut or suspension | None |
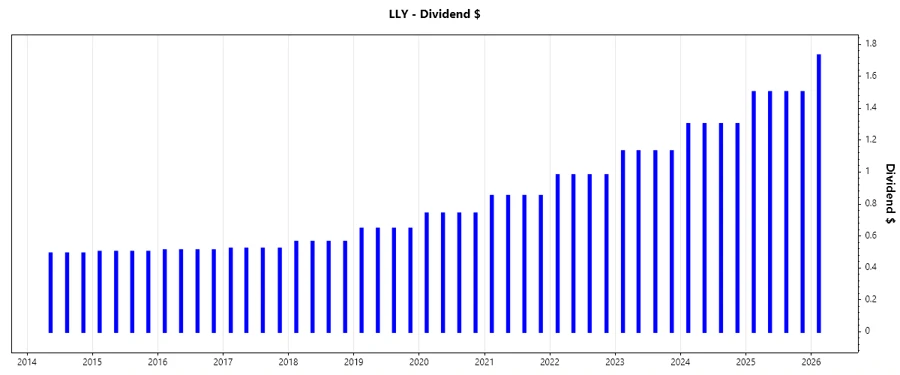
📈 Dividend History
Eli Lilly's dividend payments highlight the company's strong commitment to its shareholders, which is crucial for evaluating its long-term financial health and planning a tentative future investment strategy.
| Year | Dividend per Share (USD) |
|---|---|
| 2026 | 1.73 |
| 2025 | 6.0 |
| 2024 | 5.2 |
| 2023 | 4.52 |
| 2022 | 3.92 |
📊 Dividend Growth
An evaluation of dividend growth rate indicates the company's potential for future increases in dividend payouts. Growth metrics are essential in assessing the potential inflation-adjusted returns.
| Time | Growth |
|---|---|
| 3 years | 15.24% |
| 5 years | 15.18% |
The average dividend growth is 15.18% over 5 years. This shows moderate but steady dividend growth.
⚖️ Payout Ratio
Payout ratios indicate Eli Lilly's ability to maintain dividend payments through its earnings, thus reflecting confidence in future cash flows.
| Key figure | Ratio |
|---|---|
| EPS-based | 26.11% |
| Free cash flow-based | 59.63% |
The EPS payout ratio at 26.11% shows a conservative approach, ensuring the alignment of earnings and dividends. The 59.63% FCF payout ratio, while higher, remains within an acceptable threshold, reflecting solid cash flow generation to support dividend payments.
💰 Cashflow & Capital Efficiency
Cash flow metrics are pivotal for maintaining operations and supporting financial obligations, directly impacting dividend stability.
| 2023 | 2024 | 2025 | |
|---|---|---|---|
| Free Cash Flow Yield | -0.60% | 0.06% | 0% |
| Earnings Yield | 1.00% | 1.52% | 2.14% |
| CAPEX to Operating Cash Flow | 174.34% | 95.30% | 43.84% |
| Stock-based Compensation to Revenue | 1.84% | 1.43% | 0% |
| Free Cash Flow / Operating Cash Flow Ratio | -74.34% | 4.70% | 0% |
The evaluation of cash flow stability and capital efficiency is satisfactory. Although the negative free cash flow yield in 2023 is a point of concern, the subsequent improvement and efficient CAPEX management bolster future prospects.
📉 Balance Sheet & Leverage Analysis
Analyzing the balance sheet provides insights into the company's debt levels, highlighting leverage and liquidity metrics pertinent to financial robustness.
| 2023 | 2024 | |
|---|---|---|
| Debt-to-Equity | 234.18% | 237.06% |
| Debt-to-Assets | 39.41% | 42.74% |
| Debt-to-Capital | 70.08% | 70.33% |
| Net Debt to EBITDA | 2.62 | 1.99 |
| Current Ratio | 0.94 | 1.15 |
| Quick Ratio | 0.73 | 0.89 |
While the debt-to-equity ratio is elevated, indicating high leverage, a robust interest coverage ratio maintains adequate debt servicing capacity. Improvement in current ratio signals an upward trend in liquidity.
🏛️ Fundamental Strength & Profitability
Examining fundamental strength and profitability sheds light on the firm's operational efficiency and capacity for sustaining dividends.
| 2023 | 2024 | 2025 | |
|---|---|---|---|
| Return on Equity | 48.65% | 74.62% | 0% |
| Return on Assets | 8.19% | 13.45% | 0% |
| Margins: Net | 15.36% | 23.51% | 31.66% |
| Margins: EBIT | 20.63% | 29.88% | 40.46% |
| Margins: EBITDA | 25.11% | 33.81% | 42.86% |
| Margins: Gross | 79.25% | 81.31% | 83.79% |
| Research & Development to Revenue | 27.29% | 24.40% | 20.46% |
High ROE and ROA metrics are indicative of robust financial health, augmented by strong profit margins across the board. These fundamentals underpin confident projections for sustainable dividends.
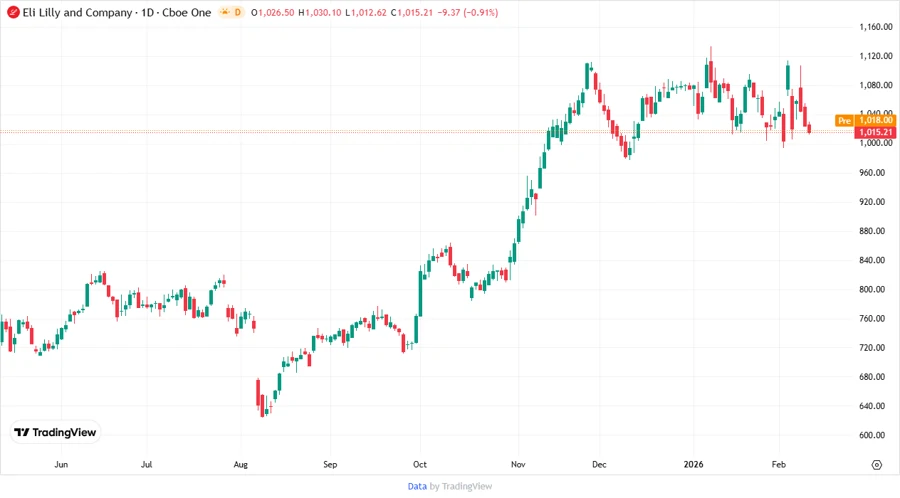
📉 Price Development
🗣️ Dividend Scoring System
| Category | Score | Score Bar |
|---|---|---|
| Dividend yield | 3 | |
| Dividend Stability | 5 | |
| Dividend growth | 5 | |
| Payout ratio | 4 | |
| Financial stability | 4 | |
| Dividend continuity | 5 | |
| Cashflow Coverage | 3 | |
| Balance Sheet Quality | 4 |
Total Score: 33/40
🗣️ Rating
Eli Lilly & Company presents a compelling investment case anchored in a robust historical dividend record and consistent growth metrics. While its current yield may not be the highest, its stability and growth prospects offer significant long-term value, offering potential for capital appreciation and a secure income stream for conservative investors seeking steady returns. Maintain a 'Buy' rating fueled by confidence in the company’s financial strategy and its ability to balance growth with shareholder returns.
Smart Data Insight
Master the Perfect Entry & Exit for this Stock
Don't leave your profits to chance. Historically, this stock follows specific seasonal patterns that institutional traders use to maximize returns.
- ✅ Identify the "Golden Buying Window"
- ✅ Avoid high-risk correction cycles
- ✅ Backtested data from the last 20+ years