October 26, 2025 a 07:31 am
LLY: Dividend Analysis - Eli Lilly and Company
Eli Lilly and Company exhibits a solid dividend history with a commendable track record of 54 years of uninterrupted payments. Its dividend yield stands at 0.83%, with a stable growth trajectory in payouts reflected by a 5-year growth rate of 15.05%. While the payout ratios signal discipline, investors should note the extreme free cash flow payout ratio, urging a focus on future cash flow stability.
📊 Overview
Eli Lilly operates in the pharmaceutical sector, known for its mature dividend policies and consistent income distribution to shareholders. The critical metrics of dividend yield and history underlie the company's commitment to deliver shareholder value.
| Factor | Details |
|---|---|
| Sector | Pharmaceutical |
| Dividend Yield | 0.83% |
| Current Dividend Per Share | 5.20 USD |
| Dividend History | 54 years |
| Last Cut or Suspension | None |
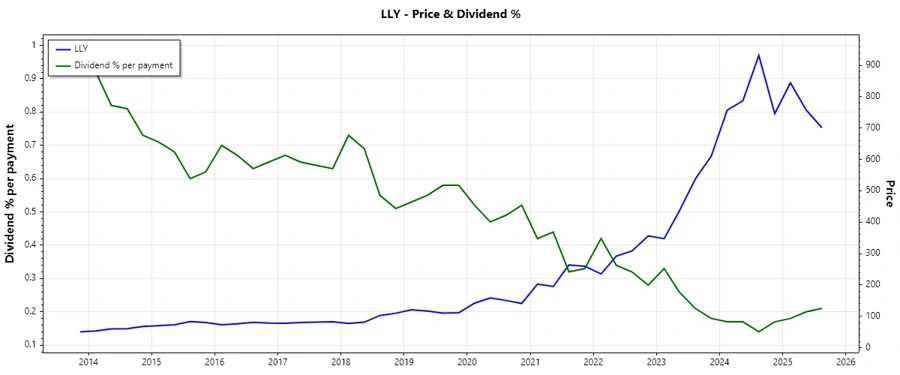
📈 Dividend History
Eli Lilly's extensive dividend history is a testament to its robust profitability and stable operations. Historical consistency underpins investor confidence in a reliable income stream.
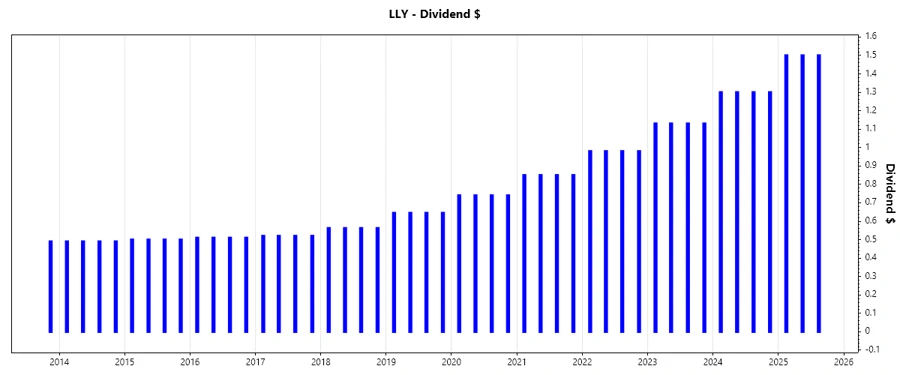
| Year | Dividend Per Share (USD) |
|---|---|
| 2025 | 4.50 |
| 2024 | 5.20 |
| 2023 | 4.52 |
| 2022 | 3.92 |
| 2021 | 3.40 |
📈 Dividend Growth
Assessing the dividend growth is crucial for investors seeking long-term profit enhancement. Steady growth indicates management's confidence and ability to generate increasing cash flows.
| Time | Growth |
|---|---|
| 3 years | 15.21% |
| 5 years | 15.05% |
The average dividend growth is 15.05% over 5 years. This shows moderate but steady dividend growth.
✅ Payout Ratio
Payout ratios provide insight into the sustainability of dividends relative to earnings and free cash flow. A balanced ratio suggests a healthy dividend policy, whereas extremes could signal risks.
| Key Figure | Ratio |
|---|---|
| EPS-based | 33.81% |
| Free cash flow-based | -9310.58% |
While the EPS payout ratio indicates a sustainable dividend policy at 33.81%, the free cash flow-based ratio is alarmingly negative, highlighting potential cash flow difficulties.
💰 Cashflow & Capital Efficiency
Analyzing cash flow and capital efficiency is essential to assess a company’s ability to sustain operations and dividend payouts without financial strain.
| Year | 2024 | 2023 | 2022 |
|---|---|---|---|
| Free Cash Flow Yield | 0.06% | -0.60% | 1.32% |
| Earnings Yield | 1.52% | 0.99% | 1.80% |
| CAPEX to Operating Cash Flow | 95.30% | 174.34% | 39.35% |
| Stock-based Compensation to Revenue | 1.43% | 1.84% | 1.30% |
| Free Cash Flow / Operating Cash Flow Ratio | 4.70% | -74.34% | 60.65% |
The negative free cash flow yield in recent years may indicate challenges in maintaining liquidity and capital efficiency, a key concern for dividend sustainability.
💳 Balance Sheet & Leverage Analysis
Evaluating leverage metrics sheds light on the company's financial stability and capital structure, crucial for assessing risks related to debt obligations.
| Year | 2024 | 2023 | 2022 |
|---|---|---|---|
| Debt-to-Equity | 237.06% | 234.18% | 152.48% |
| Debt-to-Assets | 42.74% | 39.41% | 32.81% |
| Debt-to-Capital | 70.33% | 70.08% | 60.39% |
| Net Debt to EBITDA | 1.99 | 2.62 | 1.64 |
| Current Ratio | 1.15 | 0.94 | 1.05 |
| Quick Ratio | 0.89 | 0.73 | 0.80 |
| Financial Leverage | 5.55 | 5.94 | 4.65 |
High leverage ratios highlight potential risks regarding Eli Lilly's ability to meet its financial obligations, affecting dividend continuity.
📈 Fundamental Strength & Profitability
Profitability indicators are critical in assessing a company's ability to generate earnings relative to its investments, supporting sustainable dividends.
| Year | 2024 | 2023 | 2022 |
|---|---|---|---|
| Return on Equity | 74.62% | 48.65% | 58.64% |
| Return on Assets | 13.45% | 8.19% | 12.62% |
| Return on Invested Capital | 26.36% | 19.77% | 23.45% |
| Net Margin | 23.51% | 15.36% | 21.88% |
| EBIT Margin | 29.88% | 20.63% | 25.01% |
| EBITDA Margin | 33.81% | 25.11% | 30.34% |
| Gross Margin | 81.31% | 79.25% | 76.77% |
| R&D to Revenue | 22.21% | 27.29% | 25.19% |
High profitability ratios support a solid dividend framework, yet rising R&D expenses might impact short-term profits.
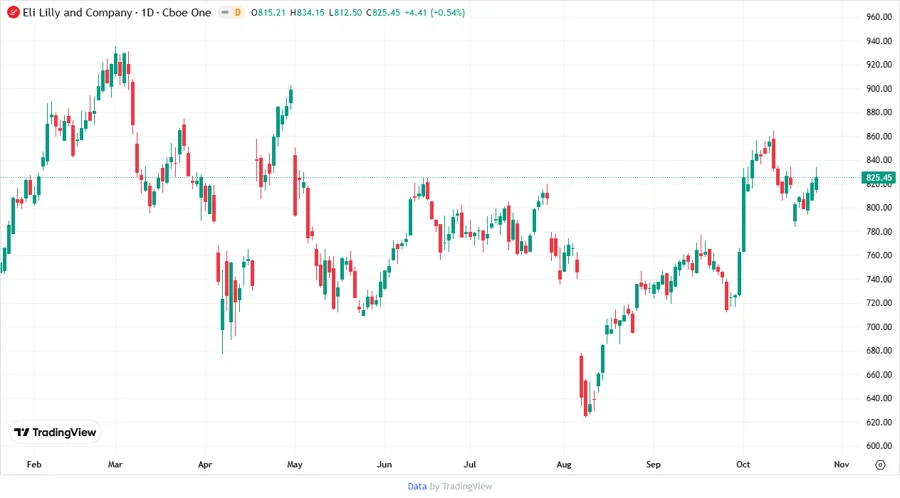
📈 Price Development
📊 Dividend Scoring System
| Criteria | Score | Bar |
|---|---|---|
| Dividend Yield | 3 | |
| Dividend Stability | 5 | |
| Dividend Growth | 4 | |
| Payout Ratio | 3 | |
| Financial Stability | 2 | |
| Dividend Continuity | 5 | |
| Cashflow Coverage | 2 | |
| Balance Sheet Quality | 3 |
Total Score: 27 out of 40
🗣️ Rating
Overall, Eli Lilly presents a compelling dividend investment with a long history and stable growth trajectory. However, attention is warranted around cash flow and leverage metrics. While the metrics show a strong foundation, potential investors should closely monitor future cash flow developments to ensure dividends remain sustainable and secure.
Smart Data Insight
Master the Perfect Entry & Exit for this Stock
Don't leave your profits to chance. Historically, this stock follows specific seasonal patterns that institutional traders use to maximize returns.
- ✅ Identify the "Golden Buying Window"
- ✅ Avoid high-risk correction cycles
- ✅ Backtested data from the last 20+ years