August 24, 2025 a 03:32 pm


LLY: Dividend Analysis - Eli Lilly and Company
Eli Lilly boasts a consistent dividend history, spanning over five decades, indicating reliability in shareholder returns. Strategic financial management keeps the payout ratio balanced, ensuring dividend safety. However, a modest dividend yield reflects its growth-oriented reinvestment strategy.
📊 Overview
Eli Lilly operates within the pharmaceutical sector, known for its resilience and steady income generation, even amid economic volatility. As of the latest data:
| Category | Details |
|---|---|
| Sector | Pharmaceuticals |
| Dividend yield | 0.83% |
| Current dividend per share | 5.20 USD |
| Dividend history | 54 years |
| Last cut or suspension | None |
🗣️ Dividend History
Eli Lilly's dividend history reflects its commitment to shareholders, maintaining payments with strategic increases for over 54 years. Historical stability demonstrates effective financial stewardship, enhancing investor confidence.
| Year | Dividend per Share (USD) |
|---|---|
| 2025 | 4.50 |
| 2024 | 5.20 |
| 2023 | 4.52 |
| 2022 | 3.92 |
| 2021 | 3.40 |
📈 Dividend Growth
The growth in dividends over the past three and five years underscores a commitment to enhancing shareholder value. Sustained dividend growth signals robust cash flow management and a focus on future profitability.
| Time | Growth |
|---|---|
| 3 years | 15.21% |
| 5 years | 15.05% |
The average dividend growth is 15.05% over 5 years. This shows moderate but steady dividend growth.
✅ Payout Ratio
The payout ratios are critical indicators of dividend sustainability. A balanced EPS-based payout ratio suggests maintained dividend affordability, while the higher FCF-based payout ratio points to reinvestment priorities.
| Key figure | Ratio |
|---|---|
| EPS-based | 33.81% |
| Free cash flow-based | 271.21% |
With an EPS-based payout ratio of 33.81%, Eli Lilly ensures the sustainability of its dividends, balancing shareholder returns with business growth strategies. The elevated FCF ratio reflects significant reinvestments.
⚠️ Cashflow & Capital Efficiency
Examining the cash flow dynamics gives insights into capital efficiency and the organization's ability to cover its obligations and fund future projects.
| Metric | 2022 | 2023 | 2024 |
|---|---|---|---|
| Free Cash Flow Yield | 1.32% | -0.60% | 0.06% |
| Earnings Yield | 1.80% | 1.00% | 1.52% |
| CAPEX to Operating Cash Flow | 39.35% | 174.34% | 95.30% |
| Stock-based Compensation to Revenue | 1.30% | 1.84% | 1.43% |
| Free Cash Flow / Operating Cash Flow Ratio | 60.65% | -74.34% | 4.70% |
Despite some volatility, the cash flow profile highlights the strength in earnings yield and strategic capital deployment necessary to support growth-oriented objectives.
📉 Balance Sheet & Leverage Analysis
Analyzing the balance sheet ratios gives insights into the company's leverage and financial stability, essential for evaluating long-term solvency.
| Metric | 2022 | 2023 | 2024 |
|---|---|---|---|
| Debt-to-Equity | 1.52 | 2.34 | 2.37 |
| Debt-to-Assets | 0.33 | 0.39 | 0.43 |
| Debt-to-Capital | 0.60 | 0.70 | 0.70 |
| Net Debt to EBITDA | 1.64 | 2.62 | 1.57 |
| Current Ratio | 1.05 | 0.94 | 1.28 |
| Quick Ratio | 0.80 | 0.73 | 0.89 |
| Financial Leverage | 4.65 | 5.94 | 5.55 |
A rigorous analysis of leverage ratios indicates manageable financial obligations, with a focus on maintaining liquidity to support operational demands.
Fundamental Strength & Profitability
Evaluating fundamentals helps in understanding operational productivity and the ability of a company to generate profits relative to investments and assets.
| Metric | 2022 | 2023 | 2024 |
|---|---|---|---|
| Return on Equity | 58.64% | 48.65% | 74.62% |
| Return on Assets | 12.62% | 8.19% | 13.45% |
| Margins - Net | 21.88% | 15.36% | 23.51% |
| Margins - EBIT | 25.01% | 20.63% | 29.88% |
| Margins - EBITDA | 30.34% | 25.11% | 33.81% |
| Margins - Gross | 76.77% | 79.25% | 81.31% |
| R&D to Revenue | 25.19% | 27.29% | 24.40% |
The consistent return on equity and improving profit margins underline Eli Lilly's robust business model, sustained by prudent R&D investments.
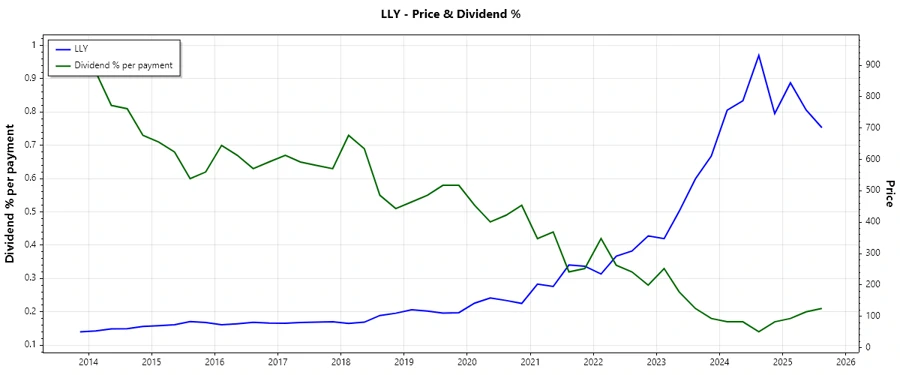
Price Development
Dividend Scoring System
| Evaluation Criteria | Score | Graph |
|---|---|---|
| Dividend yield | 2 | |
| Dividend Stability | 5 | |
| Dividend growth | 4 | |
| Payout ratio | 3 | |
| Financial stability | 4 | |
| Dividend continuity | 5 | |
| Cashflow Coverage | 3 | |
| Balance Sheet Quality | 4 |
Total Score: 30 out of 40
Rating
Eli Lilly's dividend profile reveals a well-managed balance between growth and shareholder returns. While the yield is moderate, the company assures long-term financial health through structured reinvestment and sound dividend stability. It proves to be a substantial opportunity for patient investors seeking confident dividend reliability fortified by strategic operations.
Smart Data Insight
Master the Perfect Entry & Exit for this Stock
Don't leave your profits to chance. Historically, this stock follows specific seasonal patterns that institutional traders use to maximize returns.
- ✅ Identify the "Golden Buying Window"
- ✅ Avoid high-risk correction cycles
- ✅ Backtested data from the last 20+ years