August 04, 2025 a 03:31 pm


LLY: Dividend Analysis - Eli Lilly and Company
📊 Eli Lilly, a forebearer in the pharmaceutical industry, presents an intriguing dividend portfolio characterized by a consistent history of dividend payments over 54 years without notable cuts or suspensions. Although the dividend yield sits modestly at around 0.76%, this stability can appeal to long-term investors seeking reliability in income generation. The firm exhibits a robust commitment to rewarding its shareholders while maintaining prudent financial leverage, making it a potential candidate for the long-term dividend-growth portfolio.
Overview
| Metric | Value |
|---|---|
| Sector | Healthcare |
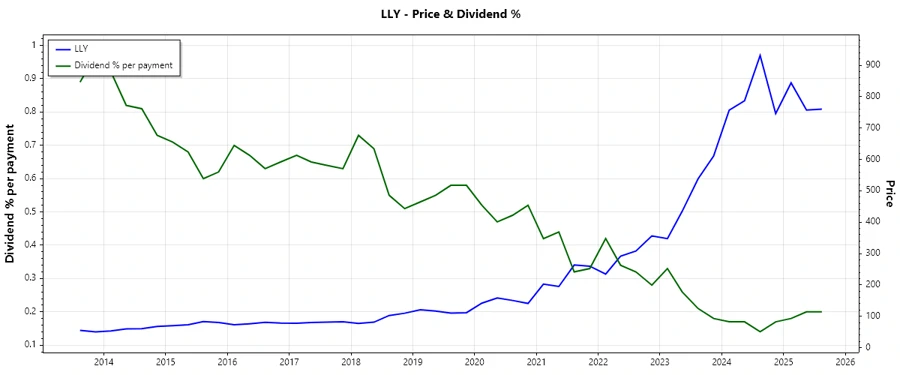
| Dividend yield | 0.76% |
| Current dividend per share | 5.20 USD |
| Dividend history | 54 years |
| Last cut or suspension | None |
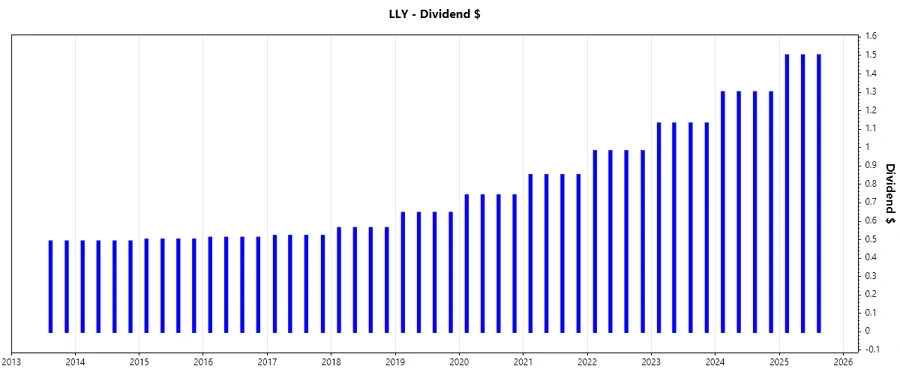
Dividend History
🗣️ Eli Lilly’s dividend history exemplifies commendable consistency with a steady increment in dividend payouts over the years. Such a track record is indicative of a resilient and well-oiled financial operation, fostering investor confidence in the firm’s commitment to dividend continuation.
| Year | Dividend Per Share (USD) |
|---|---|
| 2025 | 4.50 |
| 2024 | 5.20 |
| 2023 | 4.52 |
| 2022 | 3.92 |
| 2021 | 3.40 |
Dividend Growth
📈 Over the last 3 and 5 years, Eli Lilly’s dividends have grown by 15.21% and 15.05% respectively. This growth trajectory signals the company's robust revenue and earnings growth that supports its dividend payout strategy.
| Time | Growth |
|---|---|
| 3 years | 15.21% |
| 5 years | 15.05% |
The average dividend growth is 15.05% over 5 years. This shows moderate but steady dividend growth.
Payout Ratio
📉 Analyzing the payout ratios, Eli Lilly exhibits a moderate EPS-based payout ratio of 42.05%, indicating a balanced dividend policy that reserves ample earnings for reinvestment and growth. However, the free cash flow payout ratio standing at an elevated 1010.95% suggests that dividends are being financed out of earnings or through debt, implying potential sustainability issues if free cash flow growth does not rebound.
| Key figure | Ratio |
|---|---|
| EPS-based | 42.05% |
| Free cash flow-based | 1010.95% |
Cashflow & Capital Efficiency
✅ Eli Lilly’s cash flow situation is multifaceted, with a free cash flow yield at 0.06754% which may raise concerns over its ability to support robust dividend payments without straining operational capacity. The notable return on invested capital at 26.31% underscores efficient capital allocation conducive to fostering shareholder value.
| 2022 | 2023 | 2024 |
|---|---|---|
| 0.67% | -0.60% | 0.06% |
| 1.88% | 0.99% | 1.52% |
| 39.35% | 174.34% | 95.30% |
| 1.31% | 1.26% | 1.05% |
| Efficient cash flow management but under pressure due to high CAPEX commitments. | Slightly concerning FCF-negative scenario. | Stabilizing but requires operational improvement for growth. |
Balance Sheet & Leverage Analysis
⚠️ A deep dive into its balance sheet unveils Eli Lilly’s high leverage ratios, with a debt-to-equity ratio of 2.37. This suggests substantial leverage use, necessitating prudent financial management to mitigate risk exposure in volatile market conditions.
| 2022 | 2023 | 2024 |
|---|---|---|
| Debt/Equity: 1.52 | Debt/Equity: 2.34 | Debt/Equity: 2.37 |
| Net Debt/EBITDA: 1.63 | Net Debt/EBITDA: 2.62 | Net Debt/EBITDA: 2.18 |
| Liquidity: Balanced | Liquidity: Tightening | Liquidity: Adequate |
| Reflecting stable yet highly leveraged positions. | Riskier profile with tighter liquidity. | Stable but requiring close cash management. |
Fundamental Strength & Profitability
📈 Eli Lilly demonstrates robust profitability metrics, with an impressive return on equity of 58.64% as of 2022. Its focus on R&D with around 22.86% of revenue endorses strategic investments in innovation, essential for sustainable growth.
| 2022 | 2023 | 2024 |
|---|---|---|
| ROE: 58.64% | ROE: 48.65% | ROE: 74.62% |
| Net Margin: 21.88% | Net Margin: 15.36% | Net Margin: 23.51% |
| R&D/Revenue: 25.19% | R&D/Revenue: 27.29% | R&D/Revenue: 22.86% |
| Strong profitability and growth potential. | Key R&D investment sustains core competencies. | Yielding high profitability in anticipation of growth. |
Price Development
Dividend Scoring System
| Criteria | Rating | Score |
|---|---|---|
| Dividend yield | ✔️ | |
| Dividend stability | ✔️✔️✔️✔️ | |
| Dividend growth | ✔️✔️✔️✔️ | |
| Payout ratio | ✔️✔️✔️ | |
| Financial stability | ✔️✔️ | |
| Dividend continuity | ✔️✔️✔️✔️✔️ | |
| Cashflow coverage | ✔️ | |
| Balance sheet quality | ✔️✔️ |
Total Score: 28/40
Rating
🔍 Eli Lilly exhibits a commendable track record of consistent dividends and strategic growth investments, albeit with undisguisable financial leverage. Its investment allure is fortified by robust profitability amid the backdrop of low dividend yields and volatility in free cash flow coverage. The potential for continued dividend payments is credible, recommending Eli Lilly for those prioritizing dividend security over yield performance.
Smart Data Insight
Master the Perfect Entry & Exit for this Stock
Don't leave your profits to chance. Historically, this stock follows specific seasonal patterns that institutional traders use to maximize returns.
- ✅ Identify the "Golden Buying Window"
- ✅ Avoid high-risk correction cycles
- ✅ Backtested data from the last 20+ years