November 30, 2025 a 04:04 am

LKQ: Trend and Support & Resistance Analysis - LKQ Corporation
LKQ Corporation, a leader in the automotive parts distribution market, demonstrates a nuanced trend over the past months. While fluctuations have been evident, recent data suggests a slight downtrend with a potential to stabilize in the coming weeks. Investors should cautiously monitor support and resistance zones as they navigate market volatility. The company's global presence offers resilience, yet sector dynamics and market pressures remain key factors.
Trend Analysis
| Date | Closing Price | Trend |
|---|---|---|
| 2025-11-28 | 29.69 | ▼ Downtrend |
| 2025-11-26 | 29.58 | ▼ Downtrend |
| 2025-11-25 | 29.75 | ▼ Downtrend |
| 2025-11-24 | 29.15 | ▼ Downtrend |
| 2025-11-21 | 29.56 | ▲ Slight Uptrend |
| 2025-11-20 | 28.76 | ▼ Strong Downtrend |
| 2025-11-19 | 29.60 | ▲ Uptrend |
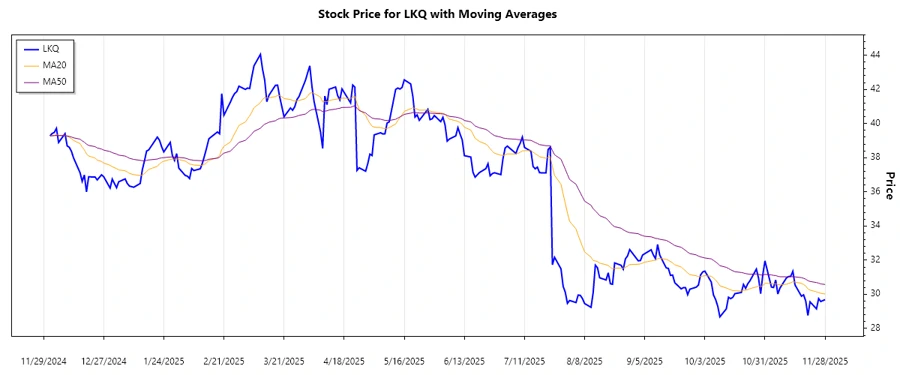
Currently, EMA20 is slightly below EMA50, indicating a consistent downward momentum with minor bullish attempts. Caution is advised as trends could shift depending on upcoming data.
Support and Resistance
| Zone Type | Zone Range | Status |
|---|---|---|
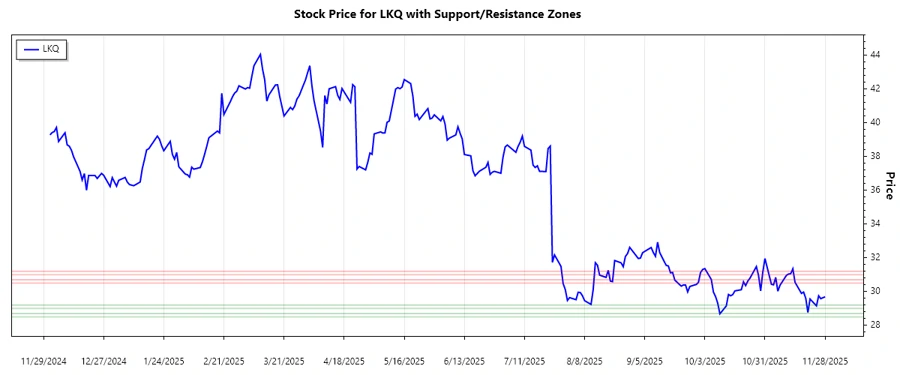
| Support 1 | $29.00 - $29.20 | ▼ Active |
| Support 2 | $28.50 - $28.70 | ▼ Pending |
| Resistance 1 | $30.50 - $30.70 | ▲ Watch |
| Resistance 2 | $31.00 - $31.20 | ▲ Monitor |
The current price is approaching the lower support zone, which could initiate a bullish reversal if it holds. Alternatively, failure to maintain this level may result in further declines.
Conclusion
LKQ Corporation's stock is facing critical support levels that could dictate future price action. While the current trend suggests a downtrend, the presence of significant support zones offers potential corrective rallies. Traders should remain vigilant of market signals and macroeconomic indicators that may impact pricing. Overall, the stock's fundamental value remains solid, but technical vigilance is crucial for informed trading decisions amid potential market fluctuations.