
July 06, 2026 a 04:03 am
LIN: Trend and Support & Resistance Analysis - Linde plc
Linde plc, a distinguished global leader in the industrial gases and engineering sector, continues to demonstrate robust performance across its extensive operations. Recent analysis suggests the company is currently experiencing strong momentum, indicating potential growth and investor interest. With a comprehensive range of products serving numerous essential industries, Linde's market position remains significant. The analysis of stock trends and support/resistance levels provides insights into its future movements. Investors should watch these levels as they navigate potential market shifts.
Trend Analysis
| Date | Close Price | Trend |
|---|---|---|
| 2026-07-02 | 546.64 | ▲ Uptrend |
| 2026-07-01 | 533.55 | ▲ Uptrend |
| 2026-06-30 | 518.94 | ▲ Uptrend |
| 2026-06-29 | 511.06 | ▲ Uptrend |
| 2026-06-26 | 519.62 | ▲ Uptrend |
| 2026-06-25 | 522.28 | ▲ Uptrend |
| 2026-06-24 | 515.73 | ▲ Uptrend |
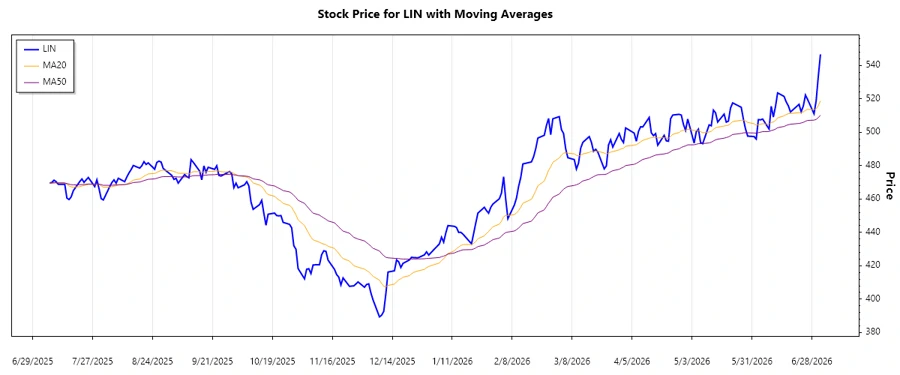
The calculated EMAs indicate a consistent uptrend over the past week. Linde's strong performance is indicative of positive investor sentiment and potential for sustained growth. This trend suggests further bullish outlook in the short term.
Support and Resistance
| Type | Zone From | Zone To | Direction |
|---|---|---|---|
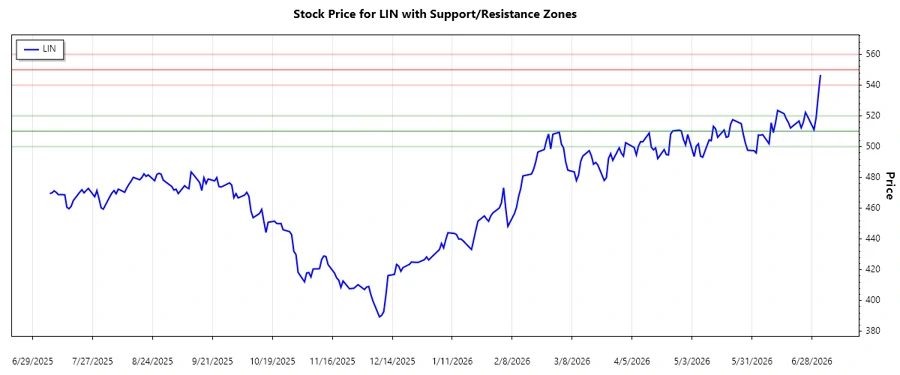
| Support | 510.00 | 520.00 | 🔼 |
| Support | 500.00 | 510.00 | 🔼 |
| Resistance | 550.00 | 560.00 | 🔽 |
| Resistance | 540.00 | 550.00 | 🔽 |
The current stock price is within the upper resistance zone, suggesting potential challenges for further price penetration without significant volume or supportive market conditions. Investors should monitor these levels for breakout potential.
In conclusion, Linde plc is evidencing an upward trend, with the current momentum supported by strong fundamentals. However, the proximity to resistance levels necessitates caution among investors awaiting a breakout or reversal. The stock's resilience and diversified portfolio present opportunities, yet mindful navigation through these technical indicators is advised.
Smart Data Insight
Master the Perfect Entry & Exit for this Stock
Don't leave your profits to chance. Historically, this stock follows specific seasonal patterns that institutional traders use to maximize returns.
- ✅ Identify the "Golden Buying Window"
- ✅ Avoid high-risk correction cycles
- ✅ Backtested data from the last 20+ years