January 26, 2026 a 11:31 am

LIN: Dividend Analysis - Linde plc
Linde plc, a global leader in industrial gases and engineering, demonstrates a solid commitment to returning value to shareholders through dividends. With a long-standing history of payments, Linde stands out in its sector for dividend stability and moderate growth, even amidst market dynamics. This analysis aims to evaluate its dividend effectiveness and financial health comprehensively.
Overview 📊
As a stalwart in the industrial sector, Linde plc offers a relatively modest dividend yield, yet impresses with its long track record of consistent payments.
| Attribute | Detail |
|---|---|
| Sector | Industrial Gases |
| Dividend Yield | 1.47 % |
| Current Dividend Per Share | 5.55 USD |
| Dividend History | 34 years |
| Last Cut or Suspension | None |
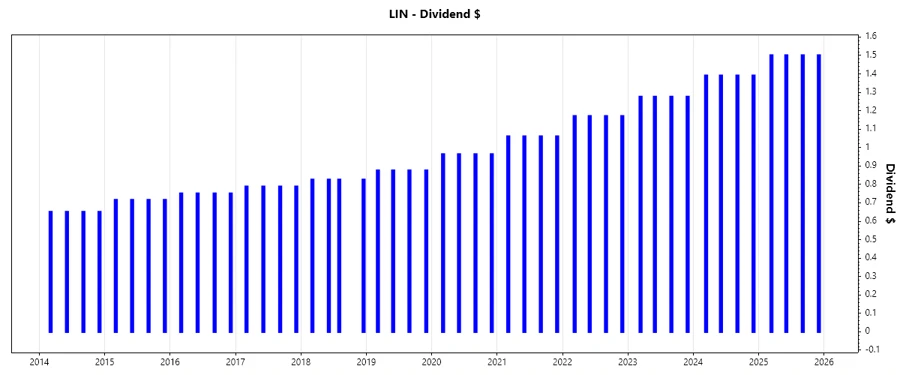
Dividend History 🗣️
Linde plc has demonstrated impressive consistency in its dividend history, crucial for investors valuing predictable income streams. This history indicates a strong focus on stability and shareholder value.
| Year | Dividend Per Share (USD) |
|---|---|
| 2025 | 6.0 |
| 2024 | 5.56 |
| 2023 | 5.10 |
| 2022 | 4.68 |
| 2021 | 4.24 |
Dividend Growth 📈
Dividend growth reflects a company’s ability to return value over time. Linde’s track record indicates a stable and consistent increase, reinforcing its appeal to income-focused investors.
| Time | Growth |
|---|---|
| 3 years | 8.63 % |
| 5 years | 9.27 % |
The average dividend growth is 9.27 % over 5 years. This shows moderate but steady dividend growth.
Payout Ratio ✅
The payout ratio is an important indicator of dividend sustainability and the potential for future growth.
| Key Figure | Ratio |
|---|---|
| EPS-based | 36.65 % |
| Free Cash Flow-based | 51.01 % |
A payout ratio of 36.65 % based on EPS and 51.01 % based on FCF suggests that Linde comfortably covers its dividends while retaining ample room for reinvestment.
Cashflow & Capital Efficiency 📉
Cash flow and capital efficiency indicators highlight Linde's ability to generate and efficiently allocate its funds. This underpins financial health and the potential for sustainable dividend payments.
| Year | 2024 | 2023 | 2022 |
|---|---|---|---|
| Free Cash Flow Yield | 2.45 % | 2.75 % | 3.49 % |
| Earnings Yield | 3.28 % | 3.09 % | 2.54 % |
| CAPEX to Operating Cash Flow | 47.72 % | 40.70 % | 35.80 % |
| Stock-based Compensation to Revenue | 0.00 % | 0.43 % | 0.32 % |
| Free Cash Flow / Operating Cash Flow Ratio | 52.28 % | 59.30 % | 64.20 % |
These figures indicate a strong cash generation capability and efficiency in capital allocation, vital for maintaining dividend distribution and potential growth opportunities.
Balance Sheet & Leverage Analysis ⚠️
Understanding leverage and balance sheet strength is essential to assess the risk profile and financial stability. These metrics gauge Linde's ability to manage debts while supporting operations and dividends.
| Year | 2024 | 2023 | 2022 |
|---|---|---|---|
| Debt-to-Equity | 59.35 % | 51.15 % | 46.94 % |
| Debt-to-Assets | 28.21 % | 25.14 % | 23.59 % |
| Debt-to-Capital | 37.25 % | 33.84 % | 31.95 % |
| Net Debt to EBITDA | 1.37 | 1.27 | 1.34 |
| Current Ratio | 0.89 | 0.80 | 0.79 |
| Quick Ratio | 0.76 | 0.67 | 0.67 |
| Financial Leverage | 2.10 | 2.03 | 1.99 |
Moderate leverage ratios indicate prudent debt management, supporting Linde's stability and continuous dividend commitments.
Fundamental Strength & Profitability 📈
Profitability metrics are crucial for assessing the overall financial performance and potential sustainability of dividends. These metrics reinforce Linde's strength in generating profits and shareholder returns.
| Year | 2024 | 2023 | 2022 |
|---|---|---|---|
| Return on Equity | 17.23 % | 15.61 % | 10.36 % |
| Return on Assets | 8.19 % | 7.67 % | 5.21 % |
| Margins: Net | 19.89 % | 18.87 % | 12.43 % |
| EBIT | 27.70 % | 25.80 % | 17.19 % |
| EBITDA | 39.15 % | 37.41 % | 29.79 % |
| Gross | 36.61 % | 35.14 % | 29.10 % |
| Research & Development to Revenue | 0.45 % | 0.44 % | 0.43 % |
High profitability and robust margins underline Linde's ability to sustain dividends and fund growth through operational excellence.
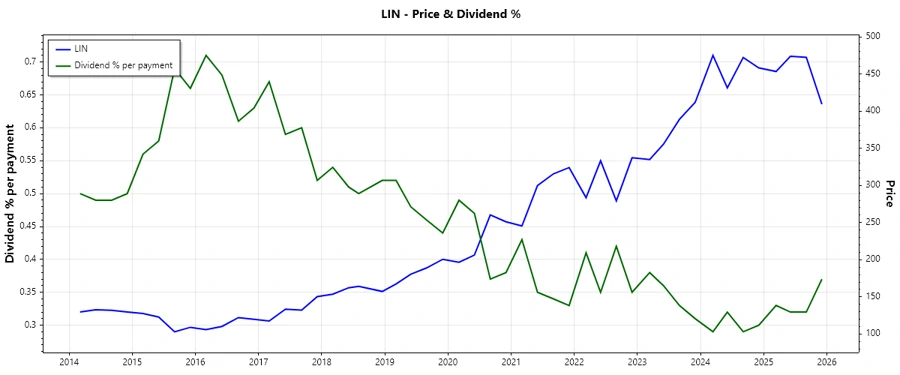
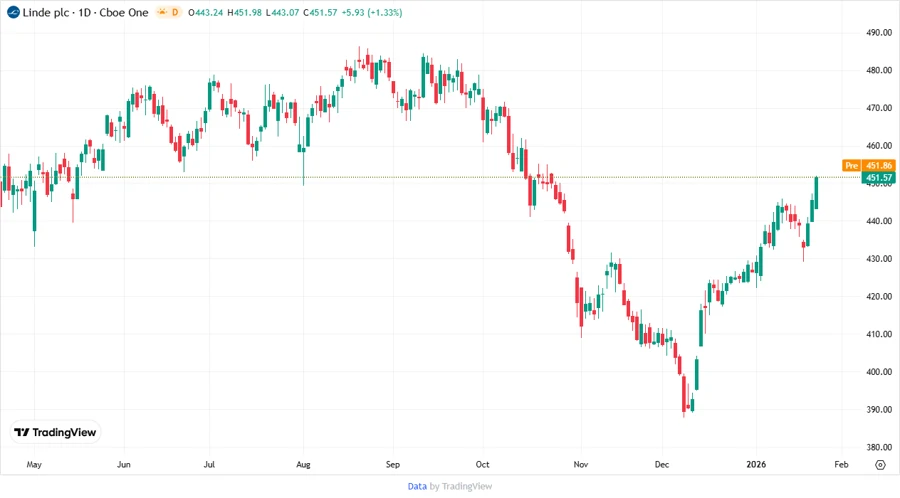
Price Development 📈
Dividend Scoring System 📊
| Category | Score | |
|---|---|---|
| Dividend yield | 3/5 | |
| Dividend Stability | 5/5 | |
| Dividend growth | 4/5 | |
| Payout ratio | 4/5 | |
| Financial stability | 4/5 | |
| Dividend continuity | 5/5 | |
| Cashflow Coverage | 4/5 | |
| Balance Sheet Quality | 4/5 |
Total score: 33/40
Rating 🏅
Based on the analysis, Linde plc exhibits strong dividend fundamentals with stability and moderate growth, complemented by solid financial health and profitability. This makes it a compelling choice for dividend-seeking investors, despite a modest yield. Overall, Linde earns a high rating for its reliable income potential and disciplined financial management.