September 05, 2025 a 03:31 am

LIN: Dividend Analysis - Linde plc
Linde plc exhibits a stable dividend profile characterized by a modest dividend yield and consistent growth. With a dividend history spanning 34 years and no recent cuts or suspensions, Linde demonstrates reliability in shareholder returns. The firm's strategic re-investment of earnings supports ongoing dividend growth, reflecting a commitment to balancing shareholder value with operational excellence.
📊 Overview
Gain insights into Linde's sector performance, yielding a stable income stream for investors.
| Key Metrics | Value |
|---|---|
| Sector | Materials |
| Dividend Yield | 1.25 % |
| Current Dividend Per Share | 5.55 USD |
| Dividend History | 34 years |
| Last Cut or Suspension | None |
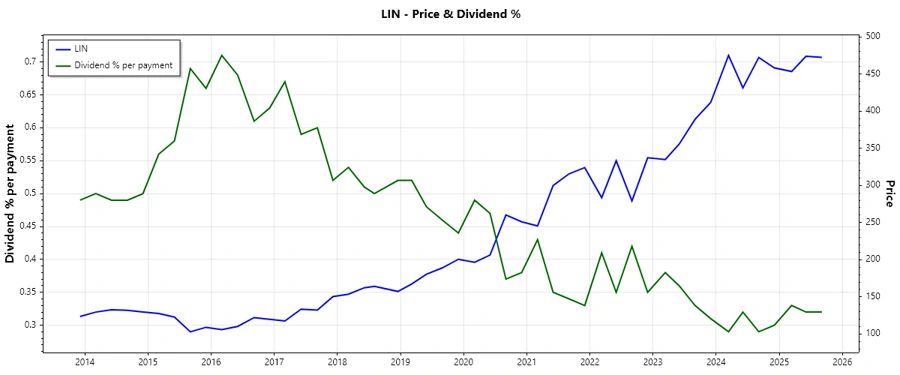
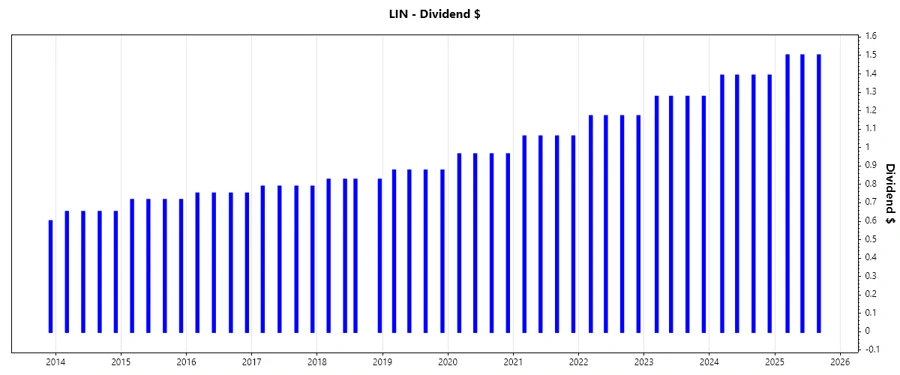
🗣️ Dividend History
Linde's robust dividend history is pivotal for long-term investors relying on steady income generation. Its resilient payout track over 34 years signals dependable shareholder returns.
| Year | Dividend per Share |
|---|---|
| 2025 | 4.50 USD |
| 2024 | 5.56 USD |
| 2023 | 5.10 USD |
| 2022 | 4.68 USD |
| 2021 | 4.24 USD |
📈 Dividend Growth
Understanding the dividend growth trajectory provides an outlook on future income potential. Linde’s consistent dividend growth conveys its profit reinvestment strategy.
| Time | Growth |
|---|---|
| 3 years | 9.46 % |
| 5 years | 9.70 % |
The average dividend growth is 9.70 % over 5 years. This shows moderate but steady dividend growth.
✅ Payout Ratio
Evaluating payout ratios helps ascertain dividend sustainability. A balanced payout ensures continued shareholder payments alongside essential business development.
| Key Figure | Ratio |
|---|---|
| EPS-based | 38.89 % |
| Free cash flow-based | 51.30 % |
The EPS-based payout ratio of 38.89% suggests shareholder value preservation, while the 51.30% FCF-based ratio indicates prudent financial management.
⚠️ Cashflow & Capital Efficiency
Analyzing cash flow ratios reveals insights into how effectively Linde translates revenue into free cash flow and its efficiency in capital utilization.
| Metric | 2024 | 2023 | 2022 |
|---|---|---|---|
| Free Cash Flow Yield | 2.46 % | 2.75 % | 3.49 % |
| Earnings Yield | 3.28 % | 3.09 % | 2.54 % |
| CAPEX to Operating Cash Flow | 47.72 % | 40.70 % | 35.80 % |
| Stock-based Compensation to Revenue | 0.48 % | 0.43 % | 0.32 % |
| Free Cash Flow / Operating Cash Flow Ratio | 52.28 % | 59.30 % | 64.20 % |
Strong cash flow ratios reflect Linde’s robust cash management strategies, supporting both operational stability and capital return initiatives.
📝 Balance Sheet & Leverage Analysis
Key ratios, such as debt metrics, offer insight into Linde's financial health and risk profile. Understanding leverage and liquidity ensures comprehensive risk assessment.
| Metric | 2024 | 2023 | 2022 |
|---|---|---|---|
| Debt-to-Equity | 59.35 % | 51.15 % | 46.94 % |
| Debt-to-Assets | 28.21 % | 25.14 % | 23.59 % |
| Debt-to-Capital | 37.25 % | 33.84 % | 31.95 % |
| Net Debt to EBITDA | 1.37 | 1.27 | 1.34 |
| Current Ratio | 0.93 | 0.80 | 0.79 |
| Quick Ratio | 0.76 | 0.67 | 0.67 |
| Financial Leverage | 2.10 | 2.03 | 1.99 |
Linde maintains a balanced leverage profile, indicating the capacity to cover debt commitments while minimizing financial risk.
📉 Fundamental Strength & Profitability
Profitability ratios and margins are crucial for evaluating a firm's operational efficiency and return potential, with equity and asset returns indicating strategic success.
| Metric | 2024 | 2023 | 2022 |
|---|---|---|---|
| Return on Equity | 17.23 % | 15.61 % | 10.36 % |
| Return on Assets | 8.19 % | 7.67 % | 5.21 % |
| Net Profit Margin | 19.89 % | 18.87 % | 12.43 % |
| EBIT Margin | 27.70 % | 25.80 % | 17.19 % |
| EBITDA Margin | 39.15 % | 37.41 % | 29.79 % |
| Gross Margin | 36.61 % | 35.14 % | 29.10 % |
| R&D to Revenue | 0.46 % | 0.44 % | 0.43 % |
Strong profitability metrics underscore Linde’s competitive strength and the ability to generate wealth for its shareholders efficiently.
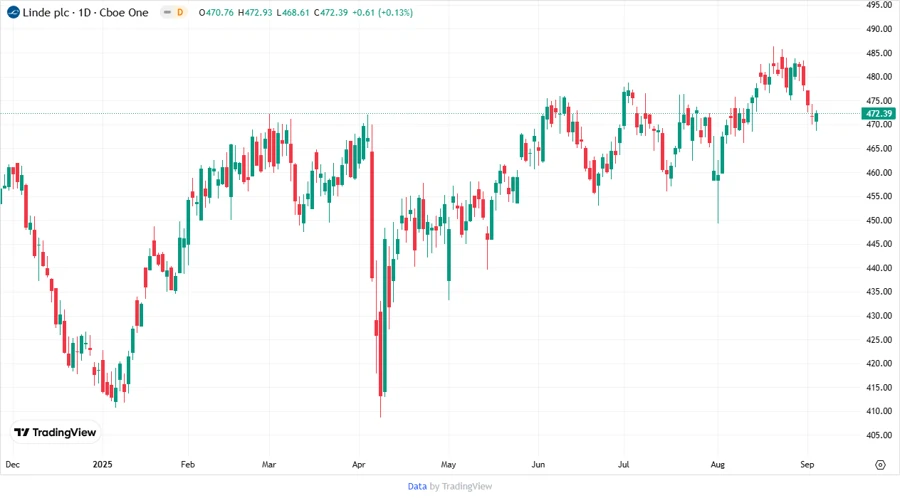
📉 Price Development
🏆 Dividend Scoring System
| Criterion | Score | Score Bar |
|---|---|---|
| Dividend Yield | 2 | |
| Dividend Stability | 5 | |
| Dividend Growth | 4 | |
| Payout Ratio | 4 | |
| Financial Stability | 4 | |
| Dividend Continuity | 5 | |
| Cashflow Coverage | 3 | |
| Balance Sheet Quality | 4 |
Overall Score: 31 out of 40
📊 Rating
Linde plc achieves a strong dividend ranking, delivering reliable income with continuous growth potential. A strong balance sheet supports sustained payouts, warranting a confident buy recommendation for long-term dividend investors.
Smart Data Insight
Master the Perfect Entry & Exit for this Stock
Don't leave your profits to chance. Historically, this stock follows specific seasonal patterns that institutional traders use to maximize returns.
- ✅ Identify the "Golden Buying Window"
- ✅ Avoid high-risk correction cycles
- ✅ Backtested data from the last 20+ years