August 09, 2025 a 12:46 pm

LIN: Dividend Analysis - Linde plc
Linde plc, as a leader in the chemical sector, stands strong with a resilient dividend profile and consistent history of payments. Diversifying their dividend strategies and maintaining steady growth, Linde plc has secured investor confidence especially with its 34-year dividend history. Its prudent financial management is reflected through robust payout ratios and steady growth in dividends while ensuring market competitiveness.
📊 Overview
Analyzing Linde plc's fundamentals reveals its stronghold in the chemical sector. Linde offers a dividend yield of 1.25% with a current dividend per share set at 5.54 USD. The company has upheld a 34-year history of continuous dividend payments.
| Sector | Dividend Yield | Current Dividend per Share | Dividend History | Last Cut or Suspension |
|---|---|---|---|---|
| Chemicals | 1.25% | 5.55 USD | 34 years | None |
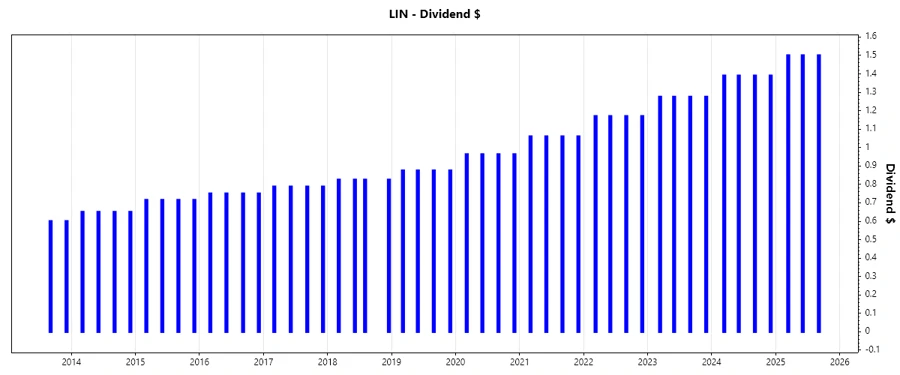
🗣️ Dividend History
Linde plc's consistent dividend policy over the last 34 years, without any cuts or suspensions, embodies financial stability. This reliability is crucial for income investors who depend on dividends as a source of revenue.
| Year | Dividend per Share (USD) |
|---|---|
| 2025 | 4.50 |
| 2024 | 5.56 |
| 2023 | 5.10 |
| 2022 | 4.68 |
| 2021 | 4.24 |
📈 Dividend Growth
Careful examination of Linde plc's dividend growth shows substantial long-term values. A pivotal metric for growth-focused investors, these figures indicate a compounded annual dividend increase which secures a long-term income stream.
| Time | Growth |
|---|---|
| 3 years | 9.46% |
| 5 years | 9.70% |
The average dividend growth is 9.70% over 5 years. This shows moderate but steady dividend growth.
✅ Payout Ratio
A critical determinant of the sustainability of dividends, the payout ratio shows how comfortably Linde plc covers dividends with its earnings and free cash flow.
| Key Figure | Ratio |
|---|---|
| EPS-based | 38.89% |
| Free cash flow-based | 51.30% |
The payout ratios of 38.89% EPS-based and 51.30% FCF-based reflect Linde's sustainable dividend policy, ensuring coverage without overextending its resources.
🌐 Cashflow & Capital Efficiency
The cash flow data indicates Linde's proficiency in generating adequate cash to sustain operations, capital expenditures, and shareholder returns. The stability underscores its adaptability against economic fluctuations.
| Metric/Year | 2024 | 2023 | 2022 |
|---|---|---|---|
| Free Cash Flow Yield | 2.46% | 2.75% | 3.49% |
| Earnings Yield | 3.28% | 3.09% | 2.54% |
| CAPEX to Operating Cash Flow | 48.86% | 40.70% | 35.80% |
| Stock-based Compensation to Revenue | 0.51% | 0.43% | 0.32% |
| Free Cash Flow / Operating Cash Flow Ratio | 52.28% | 59.30% | 64.20% |
Linde's consistent free cash flow performance, alongside optimal capital efficiency metrics, suggests effective management of operational funds to maximize shareholder wealth.
🔍 Balance Sheet & Leverage Analysis
Linde's balance sheet reflects resilient financial health with manageable leverage levels indicating prudent debt usage to finance growth strategies without compromising liquidity.
| Metric/Year | 2024 | 2023 | 2022 |
|---|---|---|---|
| Debt-to-Equity | 59.35% | 51.15% | 46.94% |
| Debt-to-Assets | 28.21% | 25.14% | 23.59% |
| Debt-to-Capital | 37.25% | 33.84% | 31.95% |
| Net Debt to EBITDA | 1.37 | 1.27 | 1.34 |
| Current Ratio | 0.93 | 0.80 | 0.79 |
| Quick Ratio | 0.75 | 0.67 | 0.67 |
| Financial Leverage | 2.10 | 2.03 | 1.99 |
These figures verify Linde's strategic debt management, supporting robust liquidity while ensuring capital growth avenues are explored judiciously.
🧩 Fundamental Strength & Profitability
Indicators of profitability such as margins and return ratios exhibit Linde’s operational excellence in maximizing returns from assets and equity invested.
| Metric/Year | 2024 | 2023 | 2022 |
|---|---|---|---|
| Return on Equity | 17.23% | 15.61% | 10.36% |
| Return on Assets | 8.19% | 7.67% | 5.21% |
| Net Margin | 19.89% | 18.87% | 12.43% |
| EBIT Margin | 27.70% | 25.80% | 17.19% |
| EBITDA Margin | 39.15% | 37.41% | 29.79% |
| Gross Margin | 36.61% | 35.14% | 29.10% |
| R&D to Revenue | 0.45% | 0.44% | 0.43% |
With elevated returns on equity and assets, alongside healthy margins, Linde showcases robust operational performance translating into investor value.
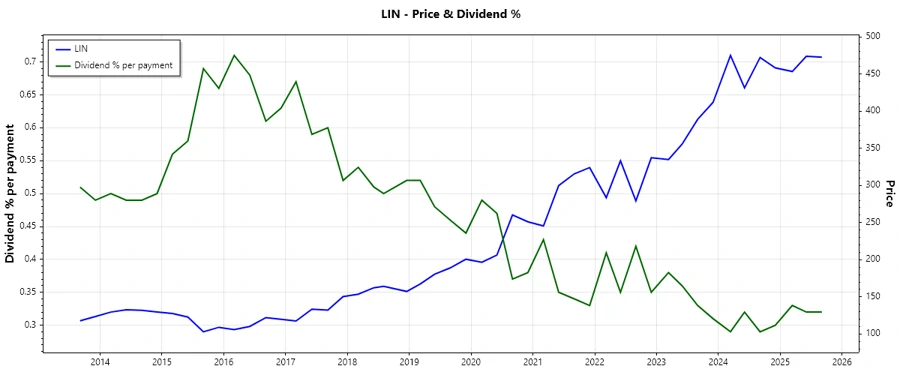
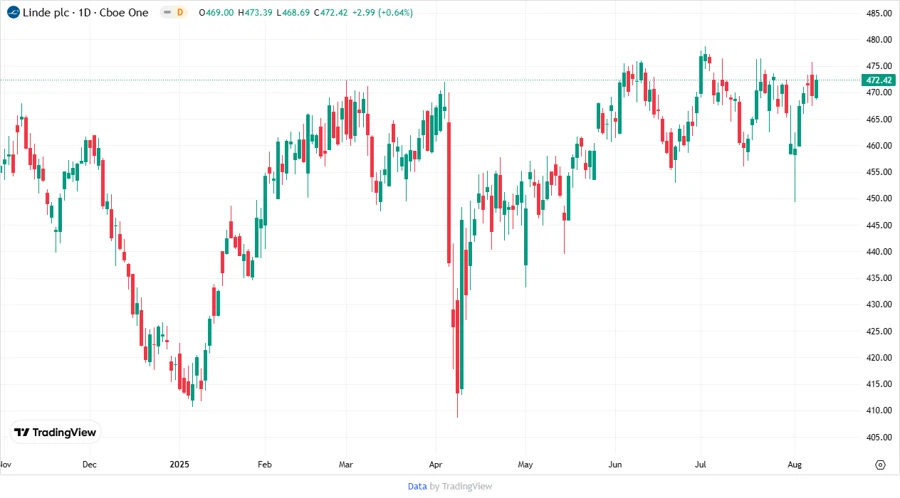
📉 Price Development
🔍 Dividend Scoring System
| Category | Score (1-5) | |
|---|---|---|
| Dividend yield | 4 | |
| Dividend Stability | 5 | |
| Dividend growth | 3 | |
| Payout ratio | 5 | |
| Financial stability | 4 | |
| Dividend continuity | 5 | |
| Cashflow Coverage | 4 | |
| Balance Sheet Quality | 4 |
Overall Score: 34 out of 40 points
⭐ Rating
In summary, Linde plc presents a strong dividend profile with steady growth and solid financial stability. This stock is recommended for inclusion in portfolios seeking reliable dividend returns combined with moderate capital appreciation potential.
Smart Data Insight
Master the Perfect Entry & Exit for this Stock
Don't leave your profits to chance. Historically, this stock follows specific seasonal patterns that institutional traders use to maximize returns.
- ✅ Identify the "Golden Buying Window"
- ✅ Avoid high-risk correction cycles
- ✅ Backtested data from the last 20+ years