November 05, 2025 a 04:45 pm
LII: Fibonacci Analysis - Lennox International Inc.
Lennox International Inc. operates in the HVACR industry with a diverse product range catering to residential and commercial segments. Recently, the stock has shown significant movement, prompting a detailed technical analysis to understand its potential behavior. The current trend shows a downward pattern from its recent highs, suggesting investor uncertainty in the near term given macroeconomic factors affecting the HVACR industry.
Fibonacci Analysis
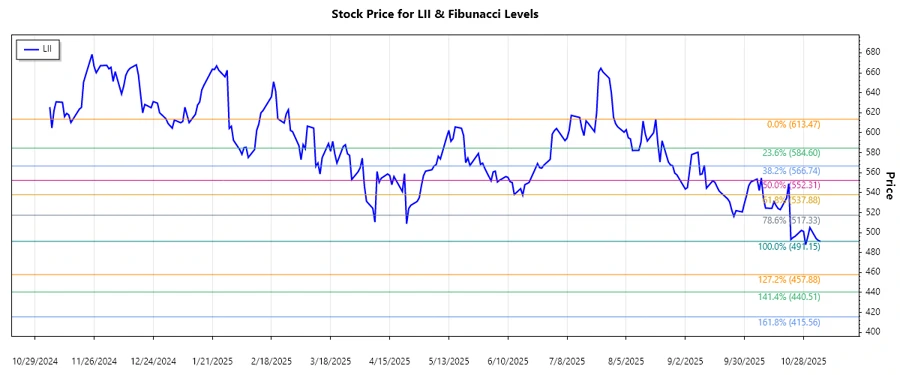
The recent trend reflects a dominant downtrend from August 19, 2025, to November 5, 2025. This period saw the stock decline from a high of $613.47 to a low of $491.15. Based on this trend, we can derive the following Fibonacci retracement levels:
| Date | Price |
|---|---|
| High: 2025-08-19 | $613.47 |
| Low: 2025-11-05 | $491.15 |
| Fibonacci Level | Price Level |
|---|---|
| 0.236 | $522.36 |
| 0.382 | $542.30 |
| 0.5 | $552.31 |
| 0.618 | $563.92 |
| 0.786 | $587.82 |
The current price is at $491.15, which indicates it is below the 0.236 retracement level, suggesting continued bearish sentiment. If prices retrace upwards, the 0.236 and 0.382 levels could act as potential resistances.
Conclusion
In the context of a broader market downturn, Lennox International Inc.'s stock has shown a marked downtrend from August to November 2025. The dominant resistance levels, as indicated by Fibonacci retracements, point towards initial hurdles at the 0.236 and 0.382 levels. These provide technical indicators for possible entry points if a reversal occurs. Conversely, persisting below the 0.236 level could signal further declines, necessitating caution. Analysts should closely monitor macroeconomic conditions and sector-specific dynamics that could influence Lennox's market positioning.
Smart Data Insight
Master the Perfect Entry & Exit for this Stock
Don't leave your profits to chance. Historically, this stock follows specific seasonal patterns that institutional traders use to maximize returns.
- ✅ Identify the "Golden Buying Window"
- ✅ Avoid high-risk correction cycles
- ✅ Backtested data from the last 20+ years