October 31, 2025 a 03:15 pm
LII: Fibonacci Analysis - Lennox International Inc.
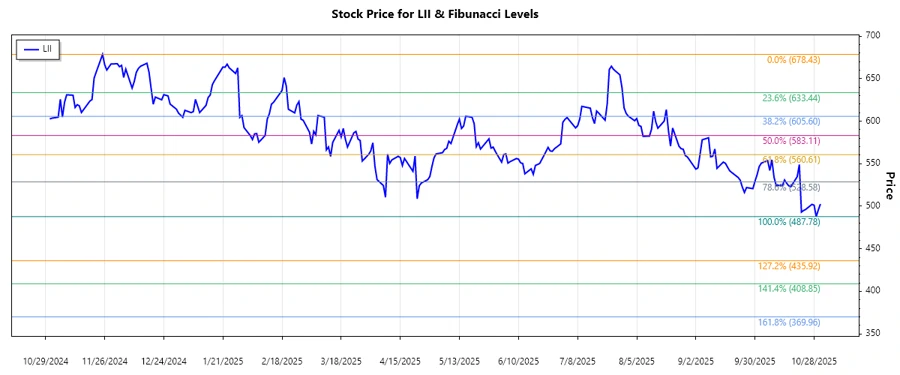
Lennox International Inc. has shown a significant downtrend over recent months. The company's stock has faced challenges due to market dynamics and competitive pressures in the HVAC industry. Investors should watch for key technical levels, as the recent price action might test support zones. Fibonacci retracement analysis can provide insight into potential reversal or continuation points for LII. Overall, this analysis aims to interpret the critical levels for potential investment decisions.
Fibonacci Analysis
| Details | Values |
|---|---|
| Start Date | 2025-07-25 |
| End Date | 2025-10-31 |
| High Price | 678.43 (2024-11-25) |
| Low Price | 487.78 (2025-10-29) |
| Fibonacci 23.6% | 531.50 |
| Fibonacci 38.2% | 562.21 |
| Fibonacci 50.0% | 583.11 |
| Fibonacci 61.8% | 603.99 |
| Fibonacci 78.6% | 631.46 |
| Current Price | 502.635 |
| Retracement Zone | None |
| Technical Interpretation | The stock remains below the retracement levels, indicating persistent bearish sentiment. Watching for a potential rebound if it approaches the 23.6% level. |
Conclusion
Lennox International Inc. has been in a downward trend, with the current price below key Fibonacci levels, signaling ongoing bearish pressure. The stock remains vulnerable unless it breaks beyond these retracement levels. Market participants should look for stabilizing patterns or bullish reversals to find potential entry points. While the technical indicators suggest caution, any positive developments in earnings or industry news could alter the current trajectory. Investors should weigh the risks given the economic climate before making commitments. Remaining vigilant on movement trends will be crucial as the market evolves.
Smart Data Insight
Master the Perfect Entry & Exit for this Stock
Don't leave your profits to chance. Historically, this stock follows specific seasonal patterns that institutional traders use to maximize returns.
- ✅ Identify the "Golden Buying Window"
- ✅ Avoid high-risk correction cycles
- ✅ Backtested data from the last 20+ years