June 30, 2026 a 02:46 am

LII: Dividend Analysis - Lennox International Inc.
Lennox International Inc. (LII) showcases a compelling dividend profile underlined by a stable payout history, moderate growth, and responsible payout ratios. With a market capitalization surpassing $19 billion and a dividend yield near 0.92%, LII demonstrates both yield potential and consistency. The company's ability to sustain long-term dividend payments without substantial cuts highlights its financial robustness.
📊 Overview
Lennox International operates in the industrial manufacturing sector, providing innovative climate control solutions for heating, air conditioning, and refrigeration. The company's current dividend yield stands at 0.92%, with a dividend per share of $4.96. With 28 years of consistent dividend history and no recent cuts or suspensions, LII emphasizes financial resilience.
| Metric | Details |
|---|---|
| Sector | Industrial Manufacturing |
| Dividend yield | 0.92% |
| Current dividend per share | $4.96 |
| Dividend history | 28 years |
| Last cut or suspension | None |
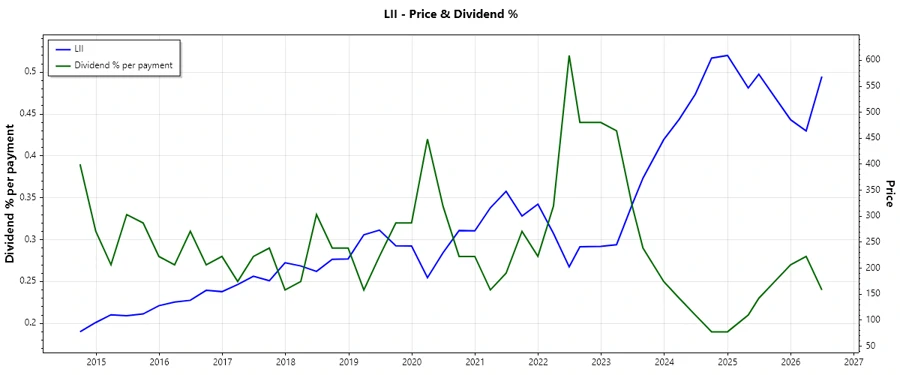
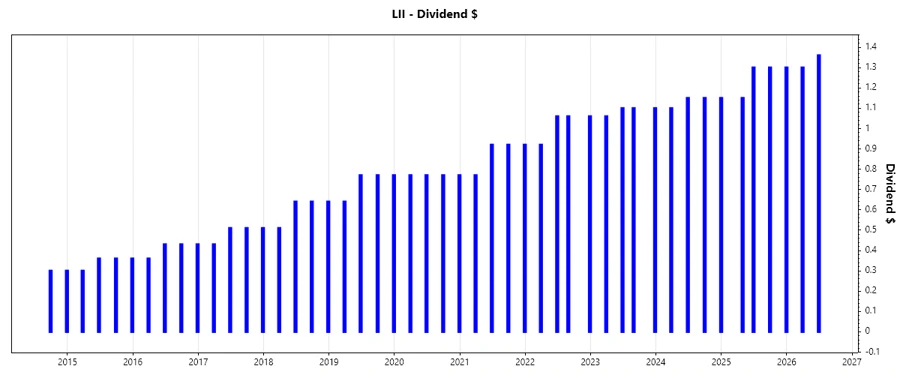
🗣️ Dividend History
An examination of Lennox's dividend history reveals a steady increment in payouts, punctuated with disciplined financial management. Holding a reliable dividend trajectory over 28 years points to the company's strategic focus on shareholder returns.
| Year | Dividend per Share (USD) |
|---|---|
| 2026* | 2.66 |
| 2025 | 5.05 |
| 2024 | 4.55 |
| 2023 | 4.36 |
| 2022 | 4.10 |
📈 Dividend Growth
Dividend growth, especially over multi-year spans, signifies a strong financial performance and management's confidence in future profitability. Lennox International's dividend has grown moderately, underscoring its balanced fiscal approach.
| Time | Growth |
|---|---|
| 3 years | 7.19% |
| 5 years | 10.39% |
The average dividend growth is 10.39% over 5 years. This shows moderate but steady dividend growth.
✅ Payout Ratio
Evaluating the payout ratio provides insights into the company's ability to sustain dividends without jeopardizing financial health. LII maintains prudent payout ratios based on EPS and free cash flow.
| Key Figure | Ratio |
|---|---|
| EPS-based | 22.03% |
| Free cash flow-based | 26.11% |
The EPS payout ratio of 22.03% signifies efficient profit distribution without over-leveraging finance, while an FCF payout of 26.11% confirms strong cash flow coverage.
📊 Cashflow & Capital Efficiency
Strong cash flow generation and capital efficiency are critical for sustaining dividend payments. Lennox International's cash flow metrics indicate robust operational performance and capital utilization.
| Year | 2025 | 2024 | 2023 |
|---|---|---|---|
| Free Cash Flow Yield | 3.77% | 3.61% | 3.06% |
| Earnings Yield | 4.64% | 3.72% | 3.71% |
| CAPEX to Operating Cash Flow | 15.68% | 17.30% | 33.99% |
| Stock-based Compensation to Revenue | 0.56% | 0.53% | 0.60% |
| Free Cash Flow / Operating Cash Flow Ratio | 84.32% | 82.70% | 66.01% |
Lennox International shows considerable prowess in cash utilization enhancing its dividend sustainability. The substantial free cash flow yield and stable cash flow ratios point to future dividend stability.
📈 Balance Sheet & Leverage Analysis
An analysis of leverage and balance sheet quality helps gauge financial flexibility and risk exposure. High liquidity ratios and manageable leverage ratios indicate sound financial positioning.
| Year | 2025 | 2024 | 2023 |
|---|---|---|---|
| Debt-to-Equity | 1.77 | 1.75 | 5.35 |
| Debt-to-Assets | 0.51 | 0.43 | 0.55 |
| Debt-to-Capital | 0.64 | 0.64 | 0.84 |
| Net Debt to EBITDA | 1.82 | 0.95 | 1.67 |
| Current Ratio | 1.60 | 1.43 | 1.41 |
| Quick Ratio | 0.63 | 0.90 | 0.72 |
| Financial Leverage | 3.51 | 4.08 | 9.81 |
Despite a high leverage ratio in 2023, Lennox's improved figures for 2024 and 2025 highlight effective financial management and risk mitigation strategies.
📉 Fundamental Strength & Profitability
Fundamental analysis of profitability and investment returns reflects the company's operational efficiency and competitive position.
| Year | 2025 | 2024 | 2023 |
|---|---|---|---|
| Return on Equity | 67.60% | 94.91% | 206.83% |
| Return on Assets | 19.26% | 23.24% | 21.09% |
| Margins: Net | 15.13% | 15.11% | 11.84% |
| Margins: EBIT | 19.48% | 19.43% | 15.93% |
| Margins: EBITDA | 21.49% | 21.21% | 17.65% |
| Margins: Gross | 33.02% | 33.17% | 31.07% |
| Research & Development to Revenue | 0% | 0% | 0% |
With robust profitability indicators, Lennox International advances its market standing, catalyzing its dividend growth capability.
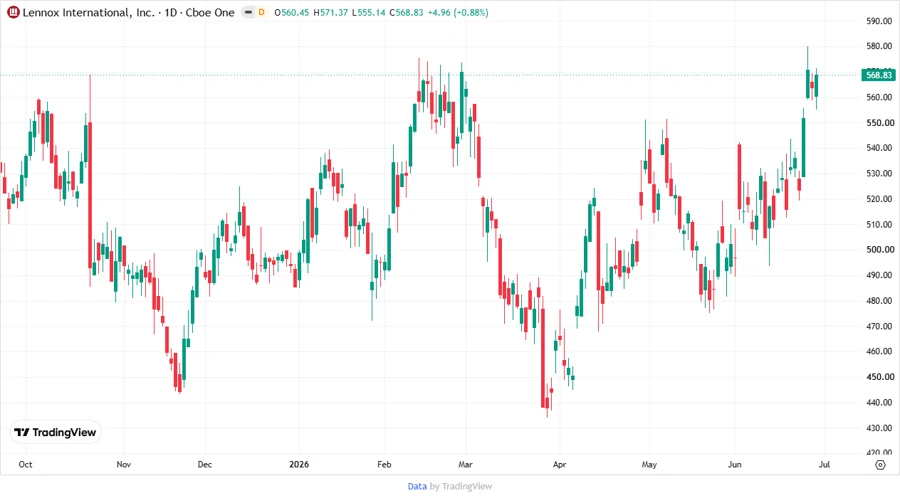
📈 Price Development
✅ Dividend Scoring System
This scoring evaluates key dividend and financial metrics, using a scale of 1 to 5 points per category, for informed investment decisions.
| Category | Points | Score |
|---|---|---|
| Dividend yield | 3 | |
| Dividend Stability | 5 | |
| Dividend growth | 4 | |
| Payout ratio | 4 | |
| Financial stability | 4 | |
| Dividend continuity | 5 | |
| Cashflow Coverage | 4 | |
| Balance Sheet Quality | 3 |
Overall Score: 32/40
🗣️ Rating
Lennox International Inc.'s consistent dividend payments, coupled with strong growth potential and robust financial oversight, make it a commendable investment for income-focused investors. With a stable cash flow and solid payout ratios, Lennox reflects a promising prospect for sustained shareholder returns.
Smart Data Insight
Master the Perfect Entry & Exit for this Stock
Don't leave your profits to chance. Historically, this stock follows specific seasonal patterns that institutional traders use to maximize returns.
- ✅ Identify the "Golden Buying Window"
- ✅ Avoid high-risk correction cycles
- ✅ Backtested data from the last 20+ years