February 07, 2026 a 11:31 am


LII: Dividend Analysis - Lennox International Inc.
Lennox International Inc. exemplifies strong dividend reliability with 27 consecutive years of growth. The current yield presents limited immediate income appeal but signifies stable capital allocation. The firm's prudent payout strategy enhances its attractiveness amidst its sector peers.
📊 Overview
Lennox International Inc. operates within the industrials sector, possessing a modest dividend yield of 1.04%. The current dividend per share stands at $4.96, bolstered by a robust history of 27 continuous years of dividend payments, with no recent cuts or suspensions.
| Metric | Value |
|---|---|
| Sector | Industrials |
| Dividend yield | 1.04% |
| Current dividend per share | $4.96 |
| Dividend history | 27 years |
| Last cut or suspension | None |
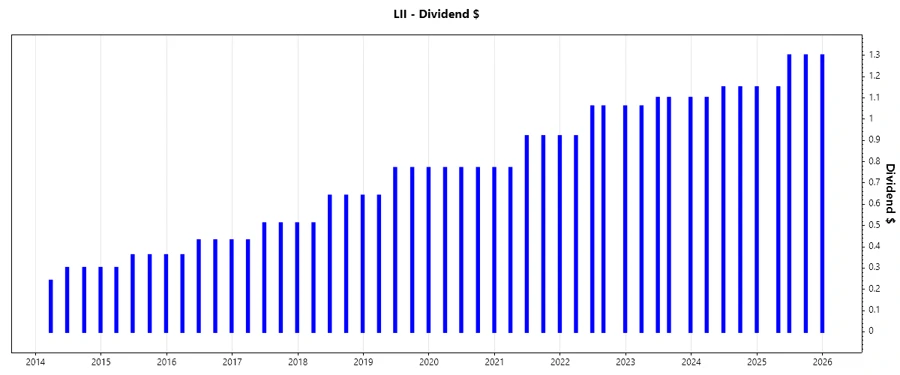
📈 Dividend History
The consistency in Lennox International’s dividend payments underlines its commitment to shareholder returns. Reliable annual increases demonstrate financial resilience and a strategic priority on dividend continuity.
| Year | Dividend Per Share (USD) |
|---|---|
| 2025 | 5.05 |
| 2024 | 4.55 |
| 2023 | 4.36 |
| 2022 | 4.10 |
| 2021 | 3.53 |
📈 Dividend Growth
Dividend growth is an essential measure of future income potential. For Lennox, the dividends have witnessed an appreciable growth of 7.19% over the last three years and 10.39% in the past five years. This performance suggests a steadfast commitment to enhancing shareholder value.
| Time | Growth |
|---|---|
| 3 years | 7.19% |
| 5 years | 10.39% |
The average dividend growth is 10.39% over 5 years. This shows moderate but steady dividend growth.
🗣️ Payout Ratio
Payout ratios gauge the sustainability of dividends. Lennox's EPS-based payout ratio is 22.00% and FCF-based payout ratio is 27.74%. These metrics indicate a conservative approach, leaving room for future dividend growth amidst potential earnings fluctuations.
| Key figure | Ratio |
|---|---|
| EPS-based | 22.00% |
| Free cash flow-based | 27.74% |
With a payout ratio of 22.00% (EPS) and 27.74% (FCF), the company ensures ample coverage for dividends, indicating robust dividend coverage and sustainability.
💰 Cashflow & Capital Efficiency
Effective cash flow management and capital efficiency are critical for financial health and continued shareholder returns. Lennox's metrics demonstrate a strategic balance, allowing for sustained growth and investment opportunities.
| Year | 2025 | 2024 | 2023 |
|---|---|---|---|
| Free Cash Flow Yield | 3.77% | 3.61% | 3.06% |
| Earnings Yield | 4.64% | 3.72% | 3.71% |
| CAPEX to Operating Cash Flow | 15.94% | 17.30% | 34.00% |
| Stock-based Compensation to Revenue | 0.56% | 0.53% | 0.60% |
| Free Cash Flow / Operating Cash Flow Ratio | 84.32% | 82.70% | 66.01% |
Stable cash flows paired with efficient allocation enhance dividend coverage, sustaining shareholder returns and operational investment.
📉 Balance Sheet & Leverage Analysis
Analyzing leverage metrics provides insight into Lennox's financial resilience. While some leverage is evident, the company's handling of debt indicates sound financial strategy and effective capital management.
| Year | 2025 | 2024 | 2023 |
|---|---|---|---|
| Debt-to-Equity | 177.47% | 175.08% | 535.33% |
| Debt-to-Assets | 50.57% | 42.88% | 54.58% |
| Debt-to-Capital | 63.96% | 63.65% | 84.26% |
| Net Debt to EBITDA | 1.82 | 0.95 | 1.67 |
| Current Ratio | 1.60 | - | - |
| Quick Ratio | 0.63 | 0.90 | 0.72 |
| Financial Leverage | 3.51 | 4.08 | 9.81 |
Lennox exhibits prudent financial leverage, managing liabilities relative to assets for maintaining robust solvency and liquidity metrics.
📈 Fundamental Strength & Profitability
Fundamental strength and profitability indicate a company's ability to generate returns and sustain growth. Lennox demonstrates strong profitability metrics, confirming effective strategic and operational management.
| Year | 2025 | 2024 | 2023 |
|---|---|---|---|
| Return on Equity | 67.60% | 94.91% | 206.83% |
| Return on Assets | 19.26% | 23.24% | 21.09% |
| Margins: Net | 15.13% | 15.11% | 11.84% |
| Margins: EBIT | 19.48% | 19.43% | 15.93% |
| Margins: EBITDA | 21.49% | 21.21% | 17.65% |
| Margins: Gross | 33.02% | 33.17% | 31.07% |
| Research & Development to Revenue | 0% | 0% | 0% |
Lennox's strong returns and healthy margins signal operational efficiency and successful exploitation of competitive advantages.
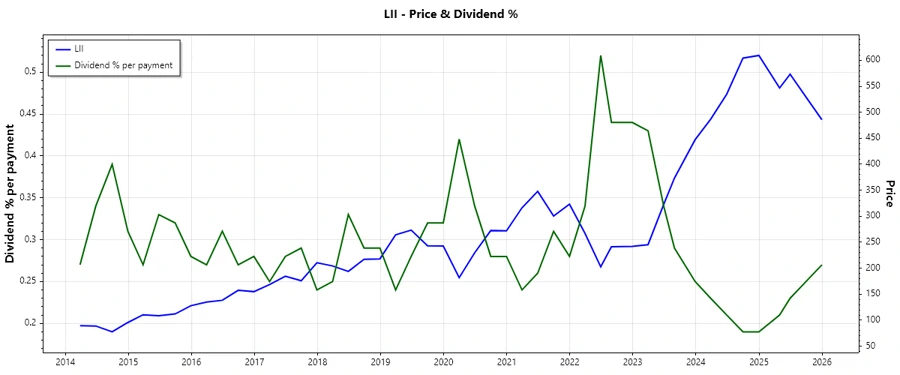
📊 Price Development
✅ Dividend Scoring System
| Category | Score | Score Bar |
|---|---|---|
| Dividend yield | 3 | |
| Dividend Stability | 5 | |
| Dividend growth | 4 | |
| Payout ratio | 5 | |
| Financial stability | 4 | |
| Dividend continuity | 5 | |
| Cashflow Coverage | 4 | |
| Balance Sheet Quality | 4 |
Overall Score: 34/40
🔍 Rating
Lennox International Inc. offers a balanced dividend profile with moderate yield and exemplary stability. The consistent growth and low payout ratios bolster its investment appeal, suitable for long-term dividend-focused investors seeking steady income without heightened risk exposure.
Smart Data Insight
Master the Perfect Entry & Exit for this Stock
Don't leave your profits to chance. Historically, this stock follows specific seasonal patterns that institutional traders use to maximize returns.
- ✅ Identify the "Golden Buying Window"
- ✅ Avoid high-risk correction cycles
- ✅ Backtested data from the last 20+ years