September 10, 2025 a 08:15 am


LH: Trend and Support & Resistance Analysis - Labcorp Holdings Inc.
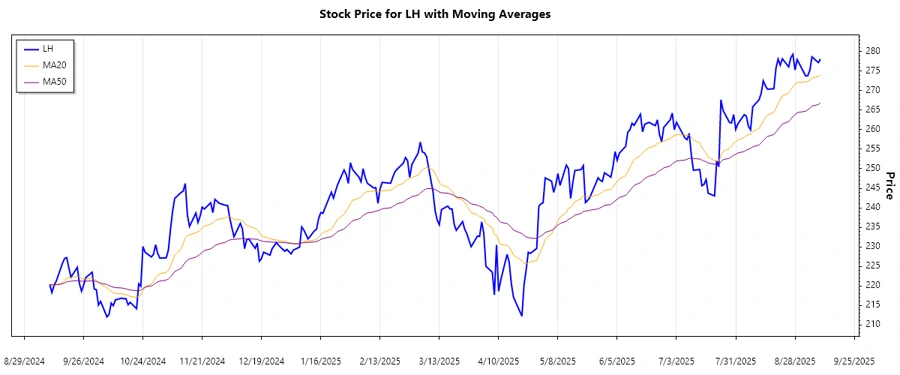
Labcorp Holdings Inc. stock has recently shown significant volatility with a general upward price movement over the past few months. The company, which provides essential laboratory services, is likely to benefit from its strategic innovations and market positioning. Investors should consider the stock's potential for upward trajectory, but also remain cautious of potential resistance levels. In technical terms, the company has shown resilience, though careful analysis of support and resistance zones is advised.
Trend Analysis
| Date | Close Price | Trend |
|---|---|---|
| 2025-09-03 | 273.84 | ▼ |
| 2025-09-04 | 275.23 | ▲ |
| 2025-09-05 | 278.67 | ▲ |
| 2025-09-08 | 277.21 | ▼ |
| 2025-09-09 | 278.11 | ▲ |
The EMA20 and EMA50 analysis over the period indicates a dominant bullish trend, as EMA20 exceeds EMA50 in most observations. This suggests potential continued upward momentum in the short term.
Support- and Resistance
| Zone Type | From | To |
|---|---|---|
| Support | 260.00 | 265.00 |
| Support | 230.00 | 240.00 |
| Resistance | 280.00 | 285.00 |
| Resistance | 290.00 | 295.00 |
The current price of $278.11 is approaching the first resistance zone, adjusting trading strategies may be necessary as entering the resistance could indicate an impending price reversal.
Conclusion
Labcorp Holdings Inc. continues to exhibit a clear upward trend as indicated by the technical indicators. However, investors should remain vigilant around the resistance zones where historical reversals have occurred. The company's market position and strategic growth initiatives offer potential upside, yet pressure from resistance levels may pose risks. Overall, careful attention to trends and price zones impacts decision-making strategies for both entering and exiting positions.
Smart Data Insight
Master the Perfect Entry & Exit for this Stock
Don't leave your profits to chance. Historically, this stock follows specific seasonal patterns that institutional traders use to maximize returns.
- ✅ Identify the "Golden Buying Window"
- ✅ Avoid high-risk correction cycles
- ✅ Backtested data from the last 20+ years