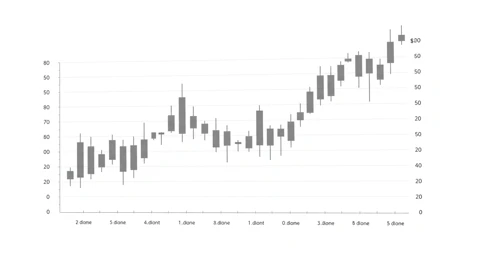
ADSK: Analysts Ratings - Autodesk Inc

ADSK: Comprehensive breakdown of current and historical analyst ratings, offering insights into how expert sentiment has evolved over time.
June 01, 2026 a 04:38 pm
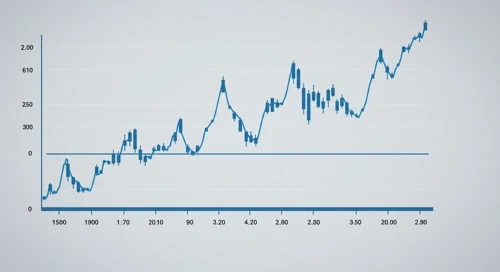
BRK B: Fundamental Ratio Analysis - Berkshire Hathaway Inc
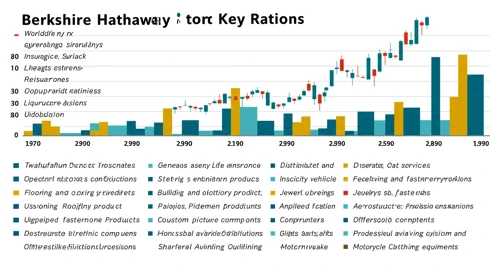
BRK-B: Evaluation of key financial ratios, analyst ratings, and price targets. A data-driven perspective on the valuation and market expectations.
June 01, 2026 a 03:43 pm
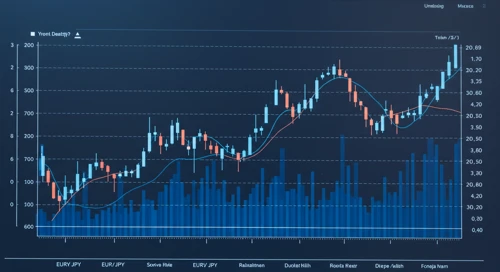
CSCO: Dividend Analysis - Cisco Systems Inc

CSCO: In-depth analysis of a company's dividend stability and key fundamental ratios to assess its financial strength and long-term investment potential.
June 01, 2026 a 03:31 pm
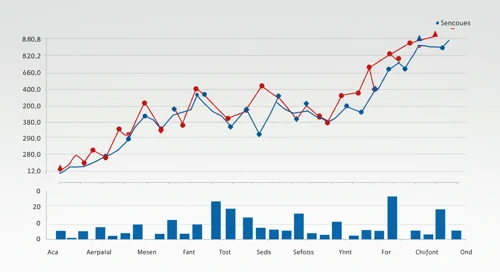
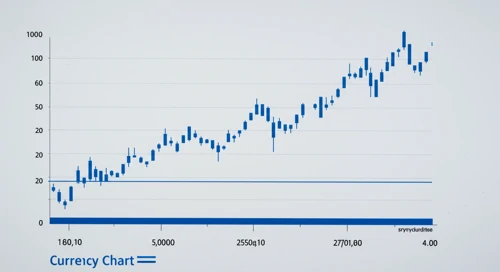
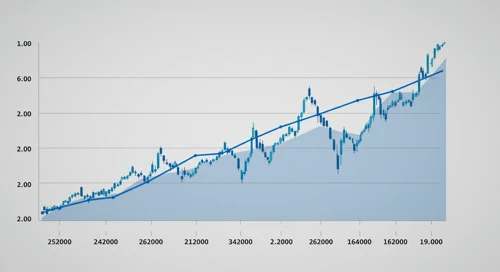
Currencies Comparison. 01 Jun

Comparison of Currencies. Where is strength and weakness? What has developed well and badly?
June 01, 2026 a 03:07 pm
SW: Trend with Support and Resistance Levels - Smurfit Westrock Plc
SW: Current price trend is evaluated alongside key support and resistance level. View of potential turning points and price momentum.
June 01, 2026 a 02:03 pm
UBER: Trend with Support and Resistance Levels - Uber Technologies Inc

UBER: Current price trend is evaluated alongside key support and resistance level. View of potential turning points and price momentum.
June 01, 2026 a 01:15 pm
SNPS: Fundamental Ratio Analysis - Synopsys Inc

SNPS: Evaluation of key financial ratios, analyst ratings, and price targets. A data-driven perspective on the valuation and market expectations.
June 01, 2026 a 01:00 pm

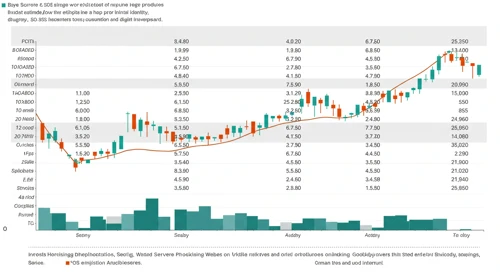
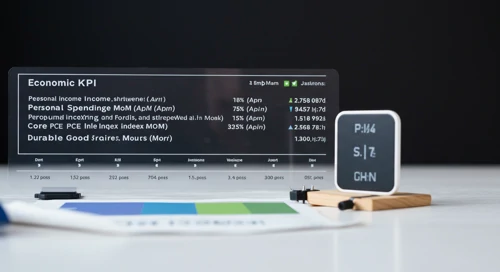
Todays Important Key Figures 01 Jun
June 01, 2026 a 07:00 pm
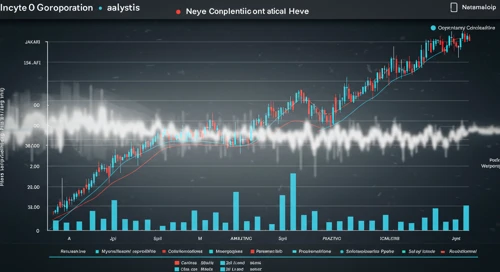
INCY: Fundamental Ratio Analysis - Incyte Corporation
June 01, 2026 a 06:00 pm
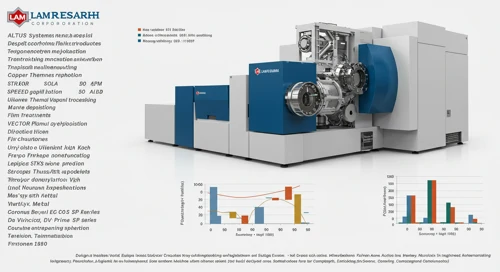
LRCX: Analysts Ratings - Lam Research Corporation
June 01, 2026 a 05:00 pm

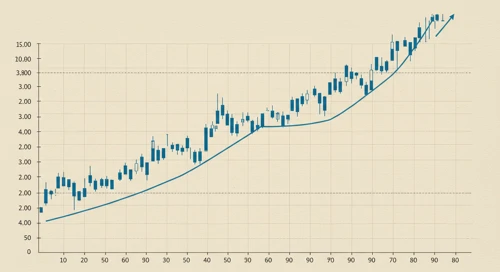
UNP: Fibunacci Level Technical Analysis - Union Pacific Corporation
June 01, 2026 a 04:44 pm
GDDY: Analysts Ratings - GoDaddy Inc
GDDY: Comprehensive breakdown of current and historical analyst ratings, offering insights into how expert sentiment has evolved over time.
June 01, 2026 a 01:00 pm
EIX: Dividend Analysis - Edison International

EIX: In-depth analysis of a company's dividend stability and key fundamental ratios to assess its financial strength and long-term investment potential.
June 01, 2026 a 12:46 pm
CMI: Analysts Ratings - Cummins Inc
CMI: Comprehensive breakdown of current and historical analyst ratings, offering insights into how expert sentiment has evolved over time.
June 01, 2026 a 12:38 pm
America Comparison. 01 Jun

Comparison of America. Where is strength and weakness? What has developed well and badly?
June 01, 2026 a 12:31 pm
DRI: Fibunacci Level Technical Analysis - Darden Restaurants Inc

DRI: Fibonacci retracement levels to identify key potential support and resistance zones, based on recent price trends.
June 01, 2026 a 11:44 am
COF: Fundamental Ratio Analysis - Capital One Financial Corporation
COF: Evaluation of key financial ratios, analyst ratings, and price targets. A data-driven perspective on the valuation and market expectations.
June 01, 2026 a 11:43 am
WELL: Dividend Analysis - Welltower Inc

WELL: In-depth analysis of a company's dividend stability and key fundamental ratios to assess its financial strength and long-term investment potential.
June 01, 2026 a 11:31 am
Stock Market - Heatmap
Use mouse wheel to zoom in and out. Click a ticker to display detailed information in a new window. Hover mouse cursor over a ticker to see more data.
Stock's
WSM: Trend with Support and Resistance Levels - Williams Sonoma Inc
WSM: Current price trend is evaluated alongside key support and resistance level. View of potential turning points and price momentum.
June 01, 2026 a 08:15 am
ERIE: Fundamental Ratio Analysis - Erie Indemnity Company

ERIE: Evaluation of key financial ratios, analyst ratings, and price targets. A data-driven perspective on the valuation and market expectations.
June 01, 2026 a 08:00 am
SRE: Dividend Analysis - Sempra
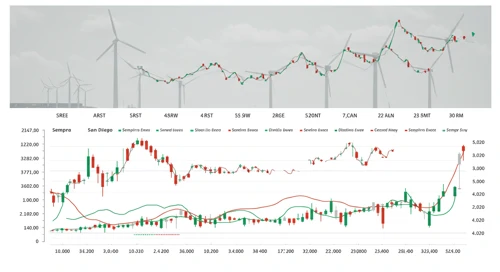
SRE: In-depth analysis of a company's dividend stability and key fundamental ratios to assess its financial strength and long-term investment potential.
June 01, 2026 a 07:46 am
ES: Fundamental Ratio Analysis - Eversource Energy
ES: Evaluation of key financial ratios, analyst ratings, and price targets. A data-driven perspective on the valuation and market expectations.
June 01, 2026 a 07:43 am
PRU: Fibunacci Level Technical Analysis - Prudential Financial Inc
PRU: Fibonacci retracement levels to identify key potential support and resistance zones, based on recent price trends.
June 01, 2026 a 06:44 am
EG: Fibunacci Level Technical Analysis - Everest Re Group Ltd

EG: Fibonacci retracement levels to identify key potential support and resistance zones, based on recent price trends.
June 01, 2026 a 05:15 am
NUE: Trend with Support and Resistance Levels - Nucor Corporation

NUE: Current price trend is evaluated alongside key support and resistance level. View of potential turning points and price momentum.
June 01, 2026 a 04:03 am
COF: Fibunacci Level Technical Analysis - Capital One Financial Corporation
June 01, 2026 a 10:15 am
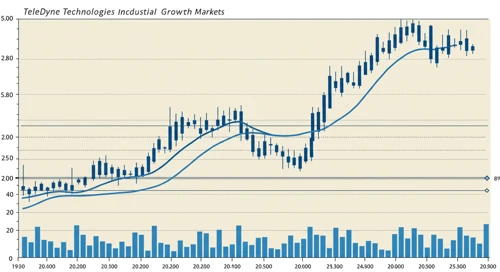
TDY: Trend with Support and Resistance Levels - Teledyne Technologies Incorporated
June 01, 2026 a 09:03 am

PGR: Analysts Ratings - The Progressive Corporation
June 01, 2026 a 09:00 am

HBAN: Analysts Ratings - Huntington Bancshares Incorporated
June 01, 2026 a 08:38 am
OXY: Dividend Analysis - Occidental Petroleum Corporation

OXY: In-depth analysis of a company's dividend stability and key fundamental ratios to assess its financial strength and long-term investment potential.
June 01, 2026 a 03:31 am
HSIC: Trend with Support and Resistance Levels - Henry Schein Inc

HSIC: Current price trend is evaluated alongside key support and resistance level. View of potential turning points and price momentum.
June 01, 2026 a 03:15 am
HAS: Dividend Analysis - Hasbro Inc
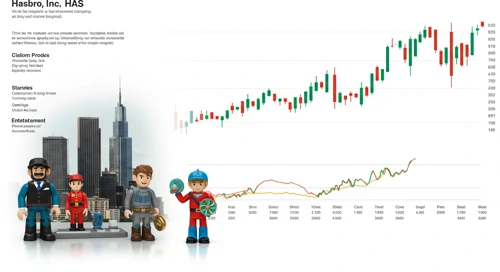
HAS: In-depth analysis of a company's dividend stability and key fundamental ratios to assess its financial strength and long-term investment potential.
June 01, 2026 a 02:46 am
TSLA: Analysts Ratings - Tesla Inc
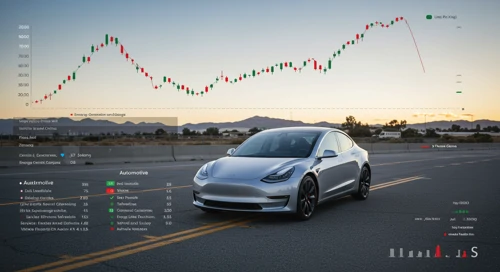
TSLA: Comprehensive breakdown of current and historical analyst ratings, offering insights into how expert sentiment has evolved over time.
May 31, 2026 a 09:00 pm
AEP: Analysts Ratings - American Electric Power Company Inc
AEP: Comprehensive breakdown of current and historical analyst ratings, offering insights into how expert sentiment has evolved over time.
May 31, 2026 a 08:38 pm
GD: Fundamental Ratio Analysis - General Dynamics Corporation
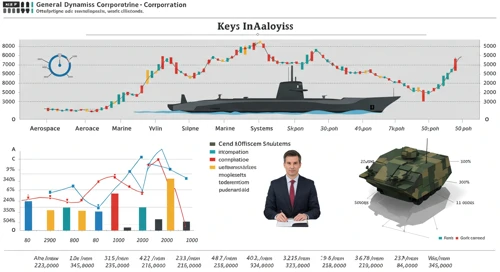
GD: Evaluation of key financial ratios, analyst ratings, and price targets. A data-driven perspective on the valuation and market expectations.
May 31, 2026 a 07:43 pm
TSN: Fundamental Ratio Analysis - Tyson Foods Inc

TSN: Evaluation of key financial ratios, analyst ratings, and price targets. A data-driven perspective on the valuation and market expectations.
May 31, 2026 a 06:00 pm
Economic Calendar
Currencies
EURUSD: Fibunacci Level Technical Analysis
EURUSD: Fibonacci retracement levels to identify key potential support and resistance zones, based on recent price trends.
May 30, 2026 a 05:08 am
NZDUSD: Trend with Support and Resistance Levels
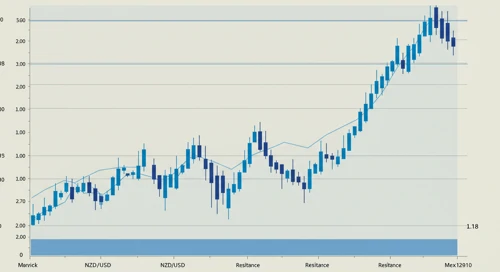
NZDUSD: Current price trend is evaluated alongside key support and resistance level. View of potential turning points and price momentum.
May 30, 2026 a 04:28 am
Todays Important Key Figures 30 May

Today’s important economic data releases – a snapshot of key indicators influencing markets and shaping financial expectations.
May 29, 2026 a 11:00 pm
Todays Important Key Figures 29 May

Today’s important economic data releases – a snapshot of key indicators influencing markets and shaping financial expectations.
May 29, 2026 a 07:00 pm
GBPNZD: Fibunacci Level Technical Analysis
GBPNZD: Fibonacci retracement levels to identify key potential support and resistance zones, based on recent price trends.
May 29, 2026 a 05:08 am
Todays Important Key Figures 28 May
Today’s important economic data releases – a snapshot of key indicators influencing markets and shaping financial expectations.
May 28, 2026 a 07:00 pm
AUDUSD: Fibunacci Level Technical Analysis
AUDUSD: Fibonacci retracement levels to identify key potential support and resistance zones, based on recent price trends.
May 28, 2026 a 05:08 am
NZDCAD: Fibunacci Level Technical Analysis
June 01, 2026 a 05:08 am

AUDCAD: Trend with Support and Resistance Levels
June 01, 2026 a 04:28 am

AUDJPY: Fibunacci Level Technical Analysis
May 31, 2026 a 05:08 am

AUDNZD: Trend with Support and Resistance Levels
May 31, 2026 a 04:28 am
USDCHF: Trend with Support and Resistance Levels
USDCHF: Current price trend is evaluated alongside key support and resistance level. View of potential turning points and price momentum.
May 28, 2026 a 04:28 am
Important Key Figures of the last Days
Overview of key economic indicators released over the past days, highlighting their potential impact on markets and investor sentiment.
May 28, 2026 a 02:31 am
Todays Important Key Figures 27 May

Today’s important economic data releases – a snapshot of key indicators influencing markets and shaping financial expectations.
May 27, 2026 a 07:00 pm
GBPAUD: Fibunacci Level Technical Analysis
GBPAUD: Fibonacci retracement levels to identify key potential support and resistance zones, based on recent price trends.
May 27, 2026 a 05:08 am
EURJPY: Trend with Support and Resistance Levels
EURJPY: Current price trend is evaluated alongside key support and resistance level. View of potential turning points and price momentum.
May 27, 2026 a 04:28 am
Todays Important Key Figures 26 May

Today’s important economic data releases – a snapshot of key indicators influencing markets and shaping financial expectations.
May 26, 2026 a 07:00 pm
CADJPY: Fibunacci Level Technical Analysis
CADJPY: Fibonacci retracement levels to identify key potential support and resistance zones, based on recent price trends.
May 26, 2026 a 05:08 am
Currencies