April 26, 2026 a 11:44 am

LH: Fibonacci Analysis - Labcorp Holdings Inc.
Labcorp Holdings Inc. has shown interesting developments over the past months. The company's stock experienced a notable decline, indicating potential challenges or external market pressures. However, recent data suggests that it may be in a phase of correction. Understanding these movements can provide investors with insights into future price action.
Fibonacci Analysis
| Start Date | End Date | High (Date) | Low (Date) |
|---|---|---|---|
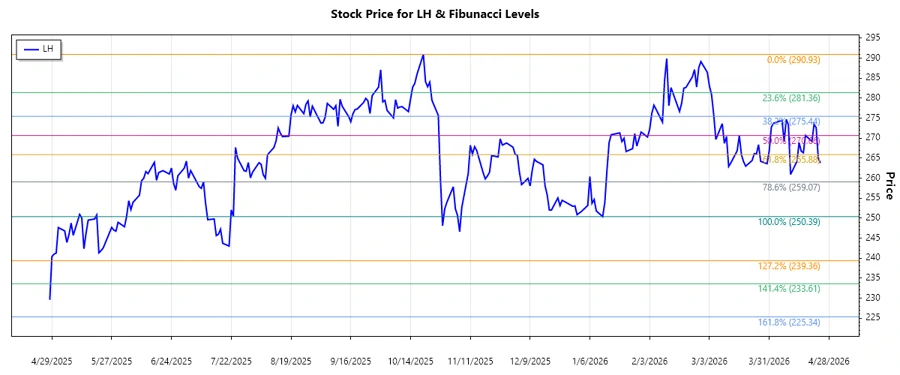
| 2025-10-20 | 2026-04-24 | 290.93 (2025-10-20) | 250.39 (2026-01-12) |
| Fibonacci Level | Price |
|---|---|
| 0.236 | 259.47 |
| 0.382 | 264.66 |
| 0.500 | 270.66 |
| 0.618 | 276.66 |
| 0.786 | 284.25 |
As of the latest data, the current price is $263.8, which places it around the 0.382 Fibonacci level. This level may act as a potential support or resistance, indicating that the stock might find some stability here before deciding its next move.
Conclusion
Labcorp Holdings Inc.'s stock is currently in a critical phase of possible correction. The Fibonacci analysis shows it near the 0.382 retracement level, suggesting potential support here. Analysts should closely monitor this level for either a break above it, signaling a recovery, or a failure to hold, which might lead to further declines. The risks remain associated with broader market dynamics and internal company performance, while opportunities lie in the stock's ability to rebound from this key technical level.