
May 28, 2026 a 03:31 pm

LH: Dividend Analysis - Labcorp Holdings Inc.
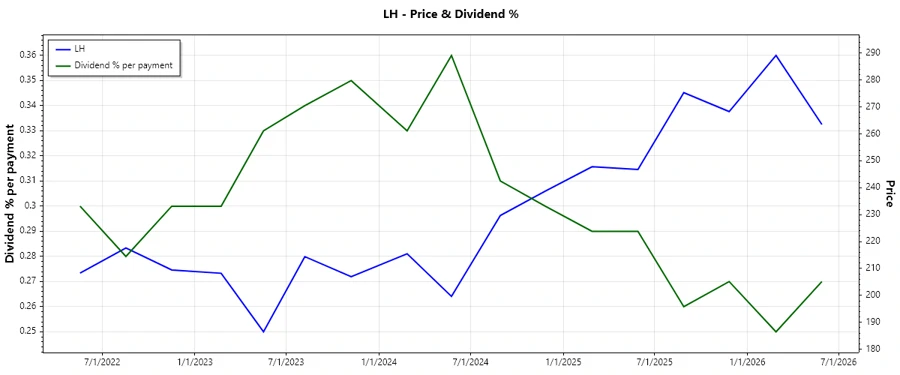
Labcorp Holdings Inc. stands as a resilient entity within its sector, offering a moderate dividend yield with potential for growth. Although the yield is not particularly high, the company's steady dividend increases over the years underscore a commitment to rewarding shareholders. With a disciplined payout ratio and a stable financial structure, Labcorp presents itself as a dependable option for income-focused investors.
Overview 📊
Labcorp Holdings Inc. operates in a dynamic sector, which dictates its dividend outputs and financial performance. The company currently displays a dividend yield of 1.09% and offers a dividend per share of 2.89 USD. With a decade-long history of consistent dividends, Labcorp signifies reliability. The absence of recent cuts or suspensions further bolsters investor confidence.
| Sector | Dividend Yield (%) | Current Dividend per Share (USD) | Dividend History (Years) | Last Cut/Suspension |
|---|---|---|---|---|
| Healthcare | 1.09 | 2.89 | 10 | None |
Dividend History 📜
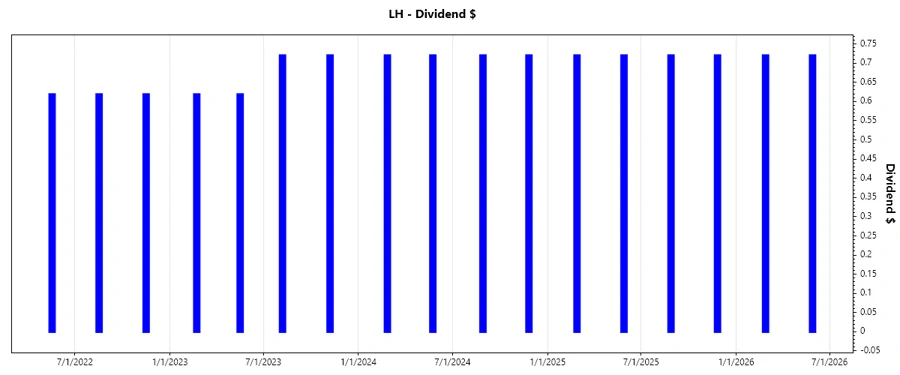
Analyzing the dividend history is crucial as it reflects a company's dedication to returning capital to its shareholders. A consistent dividend payment history often signifies underlying financial strength and management's shareholder-friendly policies.
| Year | Dividend per Share (USD) |
|---|---|
| 2026 | 1.44 |
| 2025 | 2.88 |
| 2024 | 2.88 |
| 2023 | 2.68 |
| 2022 | 1.86 |
Dividend Growth 📈
Dividend growth is a key indicator of a company's earning power and financial health. Steady growth is generally a positive sign of reinvestment and profitability. Over the past 3 years, Labcorp's dividend growth was 0.16%, while the 5-year rate was 0.76%.
| Time | Growth (%) |
|---|---|
| 3 years | 0.16 |
| 5 years | 0.76 |
The average dividend growth is 0.76% over 5 years. This shows moderate but steady dividend growth.
Payout Ratio 💹
The payout ratio is an essential metric that indicates the proportion of earnings a company pays to shareholders in dividends. Labcorp's EPS-based payout ratio stands at 25.29%, suggesting a well-managed dividend policy balanced with reinvestment strategies. The FCF-based payout ratio of 17.14% further exemplifies conservative financial management, allowing for sufficient capital reserves.
| Key Figure | Ratio (%) |
|---|---|
| EPS-based | 25.29 |
| Free cash flow-based | 17.14 |
The EPS payout ratio of 25.29% reflects conservative dividend policies, while the FCF payout ratio of 17.14% indicates robust cash flow management, suggesting room for future growth.
Cashflow & Capital Efficiency 💰
The efficiency of cash flow and capital usage directly impacts a company’s ability to sustain and grow dividends. With metrics such as a Free Cash Flow Yield of 6.41% and CAPEX to Operating Cash Flow ratio of 23.68%, Labcorp shows effective use of its operational cash flows to drive further expansion without straining its reserve.
| Year | 2025 | 2024 | 2023 |
|---|---|---|---|
| Free Cash Flow Yield | 5.78% | 5.70% | 4.42% |
| Earnings Yield | 4.20% | 3.88% | 2.11% |
| CAPEX to Operating Cash Flow | 26.49% | 30.89% | 34.16% |
| Stock-based Compensation to Revenue | 0.90% | 0.90% | 1.06% |
| Free Cash Flow / Operating Cash Flow Ratio | 73.51% | 69.11% | 65.84% |
Overall, Labcorp demonstrates strong cash flow stability with a commendable capital efficiency that supports reinvestment and expansion, enhancing shareholder returns.
Balance Sheet & Leverage Analysis 📉
A sound balance sheet and manageable leverage levels are cornerstones to sustained dividends. Labcorp's Debt-to-Equity ratio of 0.84 and a Financial Leverage ratio of 2.13 signal prudent management of debt. The Net Debt to EBITDA ratio remains at a controllable 3.02.
| Year | 2025 | 2024 | 2023 |
|---|---|---|---|
| Debt-to-Equity | 0.84 | 0.90 | 0.76 |
| Debt-to-Assets | 39.17% | 39.57% | 35.60% |
| Debt-to-Capital | 45.53% | 47.46% | 43.06% |
| Net Debt to EBITDA | 3.31 | 3.18 | 4.01 |
| Current Ratio | 1.42 | 1.44 | 1.17 |
| Quick Ratio | 1.23 | 1.30 | 1.02 |
| Financial Leverage | 2.13 | 2.28 | 2.12 |
Labcorp's financial structure is stable, with manageable debt levels, suggesting resilience and capacity to sustain its dividend payouts.
Fundamental Strength & Profitability 📊
The assessment of fundamental strength and profitability reveals insights into operational effectiveness. Labcorp's Return on Equity and Return on Assets demonstrate its ability to generate returns off its leveraged financial structure, essential for continuous dividend payouts.
| Year | 2025 | 2024 | 2023 |
|---|---|---|---|
| Return on Equity | 10.17% | 9.26% | 5.31% |
| Return on Assets | 4.77% | 4.06% | 2.50% |
| Margins: Net | 6.28% | 5.73% | 3.43% |
| Margins: Gross | 26.75% | 27.86% | 27.67% |
| Margins: EBIT | 9.54% | 8.98% | 6.32% |
| Margins: EBITDA | 14.43% | 13.92% | 11.10% |
| Research & Development to Revenue | 0% | 0% | 0.02% |
Labcorp's solid profitability metrics and strategic reinvestment into its operations support its ongoing capacity to deliver shareholder value.
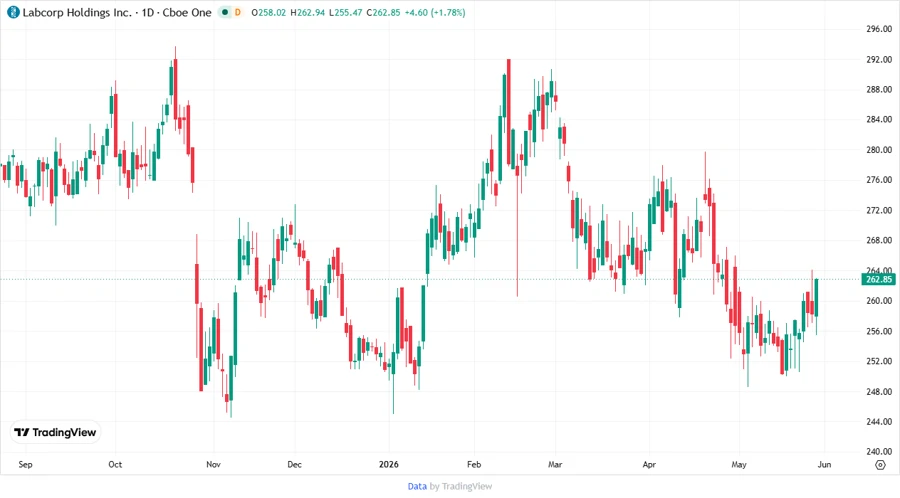
Price Development 💹
Dividend Scoring System 🗣️
| Category | Score (1-5) | Indicator |
|---|---|---|
| Dividend Yield | 2 | |
| Dividend Stability | 4 | |
| Dividend Growth | 3 | |
| Payout Ratio | 5 | |
| Financial Stability | 4 | |
| Dividend Continuity | 4 | |
| Cashflow Coverage | 5 | |
| Balance Sheet Quality | 4 |
Overall Score: 31/40
Rating 🏆
Labcorp Holdings Inc. possesses a commendable dividend profile with a strong commitment to maintaining and potentially growing its payouts. The company's strategic financial management, coupled with its high payout ratio, reflects a robust and shareholder-centric approach. Given its sound financial and operational stance, Labcorp is recommended as a reliable dividend-paying stock for long-term investors seeking moderate growth and consistent returns.
Smart Data Insight
Master the Perfect Entry & Exit for this Stock
Don't leave your profits to chance. Historically, this stock follows specific seasonal patterns that institutional traders use to maximize returns.
- ✅ Identify the "Golden Buying Window"
- ✅ Avoid high-risk correction cycles
- ✅ Backtested data from the last 20+ years