November 18, 2025 a 04:03 am


LEN: Trend and Support & Resistance Analysis - Lennar Corporation
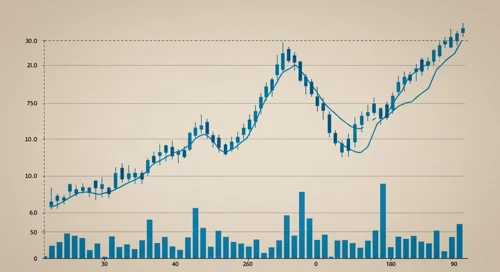
Lennar Corporation, a prominent homebuilder in the United States, has shown a fluctuating stock performance over the past months. Recent data reveals shifts in market trends that are crucial for potential investors to understand. Continued scrutiny of the technical indicators provides insights into possible future movements and stability in the price.
Trend Analysis
| Date | Close Price | Trend |
|---|---|---|
| 2025-11-17 | $114.10 | ▼ Abwärtstrend |
| 2025-11-14 | $121.11 | ▼ Abwärtstrend |
| 2025-11-13 | $121.24 | ▼ Abwärtstrend |
| 2025-11-12 | $124.13 | ▼ Abwärtstrend |
| 2025-11-11 | $125.44 | ▼ Abwärtstrend |
| 2025-11-10 | $123.21 | ⚖️ Seitwärtstrend |
| 2025-11-07 | $121.55 | ▼ Abwärtstrend |
The recent trend indicates a predominantly bearish movement in Lennar's stock as EMA20 continues to stay below EMA50. This signifies short-term weaknesses and potential for further price decline unless market factors change.
Support and Resistance
| Zone | From | To |
|---|---|---|
| Support 1 | $120.00 | $121.50 |
| Support 2 | $117.50 | $119.00 |
| Resistance 1 | $125.00 | $126.50 |
| Resistance 2 | $128.00 | $129.50 |
Currently, the stock is nearing the lower support zone, suggesting potential for either a bounce-back or further dive based on market dynamics. This emphasizes the importance of watching price movements closely as they approach these levels.
Conclusion
Lennar Corporation's stock is under pressure amid a technical downtrend, creating challenges for investors. Short-term patterns demonstrate a tendency towards further drops unless bullish conditions arise to support a reversal. Nonetheless, nearing support levels could offer buying opportunities for those anticipating a rebound. Investors must weigh risks against potential rewards, especially in a volatile housing market environment.
Smart Data Insight
Master the Perfect Entry & Exit for this Stock
Don't leave your profits to chance. Historically, this stock follows specific seasonal patterns that institutional traders use to maximize returns.
- ✅ Identify the "Golden Buying Window"
- ✅ Avoid high-risk correction cycles
- ✅ Backtested data from the last 20+ years