December 03, 2025 a 05:15 am

LEN: Fibonacci Analysis - Lennar Corporation
The Lennar Corporation stock has exhibited notable volatility over recent months, influenced by macroeconomic factors and the U.S. housing market dynamics. The technical analysis indicates a bearish trend with various opportunities for potential re-entries. Lennar's role in homebuilding and financial services positions it uniquely amid the current real estate developments.
Fibonacci Analysis
| Detail | Value |
|---|---|
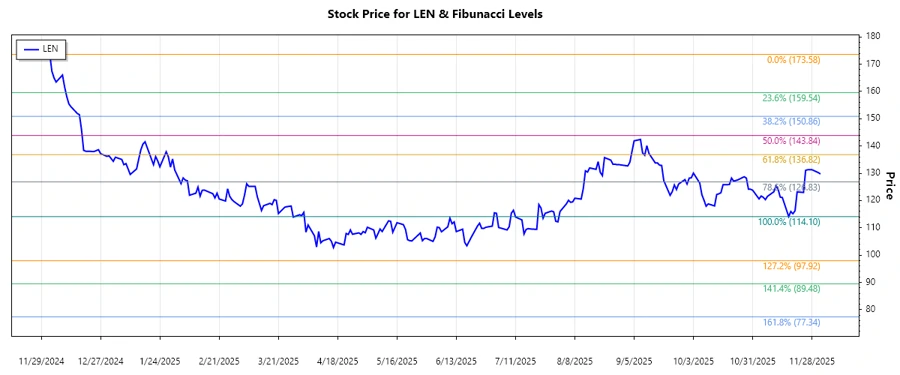
| Start Date | 2024-12-03 |
| End Date | 2025-12-02 |
| High (Date & Price) | 2024-12-03, $173.58 |
| Low (Date & Price) | 2025-11-17, $114.10 |
| 0.236 Retracement | $126.07 |
| 0.382 Retracement | $136.38 |
| 0.5 Retracement | $143.84 |
| 0.618 Retracement | $151.31 |
| 0.786 Retracement | $162.25 |
| Current Price Retracement Zone | None |
| Technical Interpretation | The current price remains below the 23.6% retracement level, signaling further downside potential. If support holds above $114, a consolidation is likely. |
Conclusion
The current technical outlook for Lennar Corporation highlights its sensitivity to broader economic conditions and interest rates fluctuations. The prevailing downtrend reflects potential challenges within the housing sector; however, opportunities exist should the stock find support and form a base above the recent lows. Analysts should closely monitor macroeconomic indicators and housing data, as these will play a critical role in stock trajectory going forward. Continuing volatility implies both risky and rewarding prospects for investors based on strategic entry and exit timings.