September 14, 2025 a 05:15 am
LEN: Fibonacci Analysis - Lennar Corporation
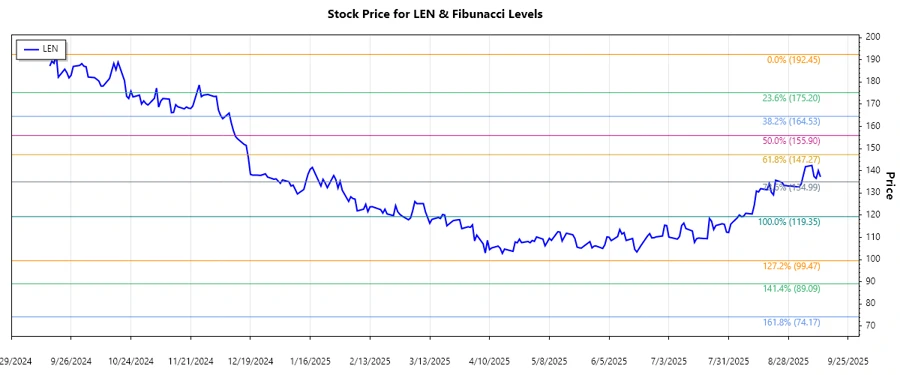
Lennar Corporation, known for its robust presence in the U.S. housing market, has experienced significant price movements over the past few months. The identified trend presents a crucial opportunity to understand key retracement levels. The company's diversified operations in homebuilding and financial services make its stock an interesting watch for analysts, particularly with the recent identifiable downtrend.
Fibonacci Analysis
| Trend Start Date | Trend End Date | High Price | High Date | Low Price | Low Date |
|---|---|---|---|---|---|
| 2024-09-19 | 2025-09-12 | 192.45 | 2024-09-19 | 119.35 | 2025-08-06 |
| Fibonacci Level | Price Level |
|---|---|
| 0.236 | 139.03 |
| 0.382 | 153.18 |
| 0.5 | 160.90 |
| 0.618 | 168.61 |
| 0.786 | 182.12 |
The current price is hovering around the 0.236 Fibonacci level, suggesting that the stock may find support here. This alignment could present potential buying opportunities, or signal further downward pressure if this level is broken.
Conclusion
The Lennar Corporation's stock has navigated through significant levels and remains a focal point for investment observation. The ongoing retracement, touching the 0.236 level, presents a pivotal juncture— with opportunities for value buyers and risks for those wary of further declines. This analysis underscores the importance of maintaining vigilant observation for possible trend reversals or confirmation of the downtrend, informing strategic decisions for stakeholders.
Smart Data Insight
Master the Perfect Entry & Exit for this Stock
Don't leave your profits to chance. Historically, this stock follows specific seasonal patterns that institutional traders use to maximize returns.
- ✅ Identify the "Golden Buying Window"
- ✅ Avoid high-risk correction cycles
- ✅ Backtested data from the last 20+ years