March 19, 2026 a 03:31 pm

LEN: Dividend Analysis - Lennar Corporation
Lennar Corporation showcases a resilient dividend history with over four decades of uninterrupted payouts, which reflects both financial stability and a commitment to rewarding shareholders. Despite a relatively modest dividend yield compared to higher-yielding sectors, the potential for growth remains compelling, bolstered by a recorded dividend progress over recent years. However, the firm’s high free cash flow payout ratio indicates potential constraints in capital flexibility if profit margins were to tighten.
📊 Overview
Lennar Corporation operates within the construction and real estate development sector, reflecting in modest but stable dividend provisions enhanced by steady capital gain prospects.
| Category | Details |
|---|---|
| Sector | Construction & Real Estate |
| Dividend yield | 1.74 % |
| Current dividend per share | $2.02 |
| Dividend history | 43 years |
| Last cut or suspension | None |
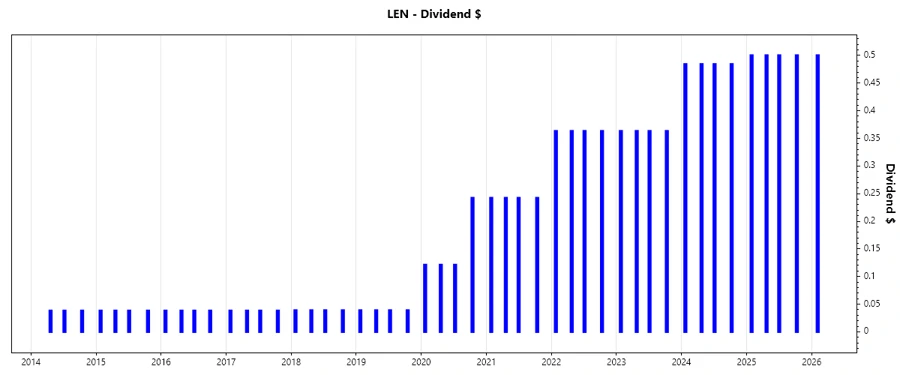
🗣️ Dividend History
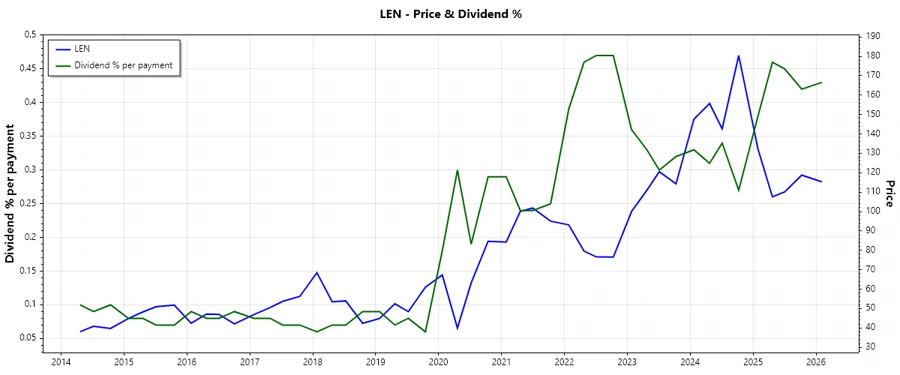
The company’s 43-year dividend history is impressive, signifying its resilience and focus on shareholder returns. This significant history underscores the firm’s robust cash flow management and strategic foresight. Yet, only gradual dividend escalation has been observed, which is a pertinent aspect for income-oriented investors.
| Year | Dividend per Share (USD) |
|---|---|
| 2026 | 0.50 |
| 2025 | 2.00 |
| 2024 | 1.94 |
| 2023 | 1.45 |
| 2022 | 1.45 |
📈 Dividend Growth
The 3-year dividend growth at 11% indicates a gradual increase in shareholder returns, reflecting positive corporate earnings and retained financial capabilities. The importance of consistent growth is crucial to match or exceed inflation rates and provide a real income increase over time.
| Time | Growth |
|---|---|
| 3 years | 11.26 % |
| 5 years | 27.01 % |
The average dividend growth is 27.01% over 5 years. This shows moderate but steady dividend growth.
📉 Payout Ratio
The payout ratio assesses the sustainability of the current dividend level. Lower ratios usually suggest a safer dividend, while higher ratios may imply potential dividend cuts if earnings dwindle.
| Key figure | Ratio |
|---|---|
| EPS-based | 27.63 % |
| Free cash flow-based | 1815.68 % |
An EPS-based payout ratio of 27.63% indicates a conservative payout policy, enhancing sustainability, while an exorbitant FCF-based ratio at 1815.68% suggests challenges in sustaining current dividend levels purely from generated cash flows.
✅ Cashflow & Capital Efficiency
Understanding cash flow dynamics and capital efficiency is vital in evaluating a company’s financial health and operational prowess. Such insights indirectly influence dividend stability and growth potential.
| Ratio | 2023 | 2024 |
|---|---|---|
| Free Cash Flow Yield | 0.14% | 4.70% |
| Earnings Yield | 10.87% | 8.29% |
| CAPEX to Operating Cash Flow | 1.93% | 7.14% |
| Stock-based Compensation to Revenue | 0.47% | 0.50% |
| Free Cash Flow / Operating Cash Flow Ratio | 98.07% | 92.86% |
Although the free cash flow yield and earnings yield suggest positive aspects of profitability, high CAPEX relative to operating cash flow may hinder immediate profit reinvestment capabilities.
⚠️ Balance Sheet & Leverage Analysis
The balance sheet and leverage ratios provide insights into financial stability, risk exposure, and liquidity positioning, crucial for analyzing dividend continuation capabilities.
| Ratio | 2023 | 2024 |
|---|---|---|
| Debt-to-Equity | 19.33% | 15.97% |
| Debt-to-Assets | 13.10% | 10.78% |
| Debt-to-Capital | 16.20% | 13.77% |
| Net Debt to EBITDA | -26.64% | -9.91% |
| Current Ratio | 4.04 | 3.44 |
| Quick Ratio | 1.23 | 0.85 |
| Financial Leverage | 1.48 | 1.57 |
Lennar's financial leverage and its capacity to sustain short-term liabilities with liquid assets enhance its strategic positioning, fostering continued dividend efficacy under moderate leverage conditions.
📊 Fundamental Strength & Profitability
Investors often gauge fundamental strength through profitability metrics, which indicate an organization’s operational efficiency and return on capital. This influences both dividend strategies and long-term investor confidence.
| Ratio | 2023 | 2024 | 2025 |
|---|---|---|---|
| Return on Equity | 14.82% | 14.11% | 9.37% |
| Return on Assets | 10.04% | 9.52% | 5.98% |
| Net Margin | 11.49% | 11.08% | 6.02% |
| EBIT Margin | 15.22% | 14.67% | 8.27% |
| EBITDA Margin | 15.54% | 14.99% | 8.66% |
| Gross Margin | 23.99% | 22.59% | 17.74% |
The established returns across equity and asset bases alongside stable margins reflect Lennar’s strong operational effectiveness, legitimately supporting its strategic dividend growth initiatives.
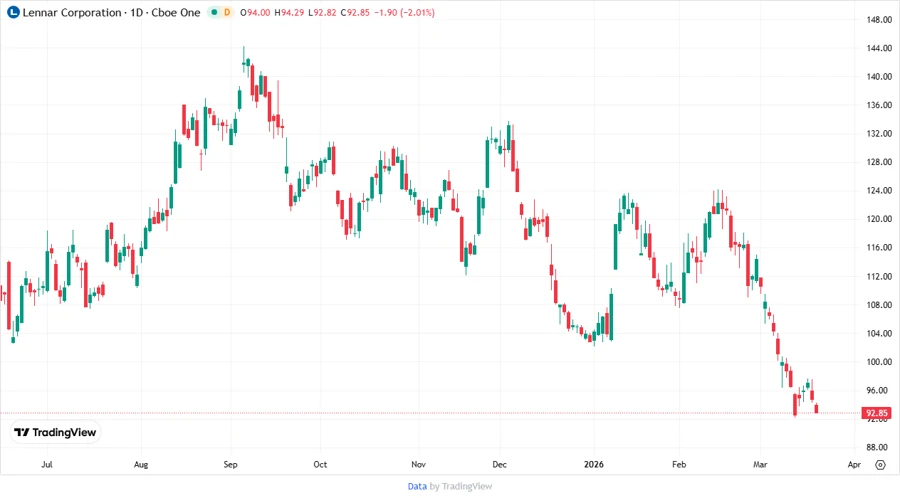
📈 Price Development
💬 Dividend Scoring System
Evaluating the dividend profile through a comprehensive scoring system aids stakeholders in understanding the company’s capacity to sustain and grow dividends.
| Criterion | Rating (1-5) | Score |
|---|---|---|
| Dividend Yield | 2 | |
| Dividend Stability | 4 | |
| Dividend Growth | 3 | |
| Payout Ratio | 3 | |
| Financial Stability | 4 | |
| Dividend Continuity | 5 | |
| Cashflow Coverage | 2 | |
| Balance Sheet Quality | 4 |
Overall Score: 27/40
📝 Rating
Lennar Corporation’s dividend policy, underlying financial stability, and growth potential make it a strong contender for conservative investors seeking long-term growth. However, potential investors should balance with limitations in current cash flow figures against a generally robust profit backdrop to make informed decisions.
Smart Data Insight
Master the Perfect Entry & Exit for this Stock
Don't leave your profits to chance. Historically, this stock follows specific seasonal patterns that institutional traders use to maximize returns.
- ✅ Identify the "Golden Buying Window"
- ✅ Avoid high-risk correction cycles
- ✅ Backtested data from the last 20+ years