October 16, 2025 a 03:31 pm

LEN: Dividend Analysis - Lennar Corporation
Lennar Corporation, a prominent player in the homebuilding industry, presents a compelling dividend profile with a notable history of payments spanning over four decades. The company's strategic dividend policy highlights its commitment to shareholder returns through consistent and sustainable dividends. Its robust market cap and impressive financial metrics underscore a stable foundation.
📊 Overview
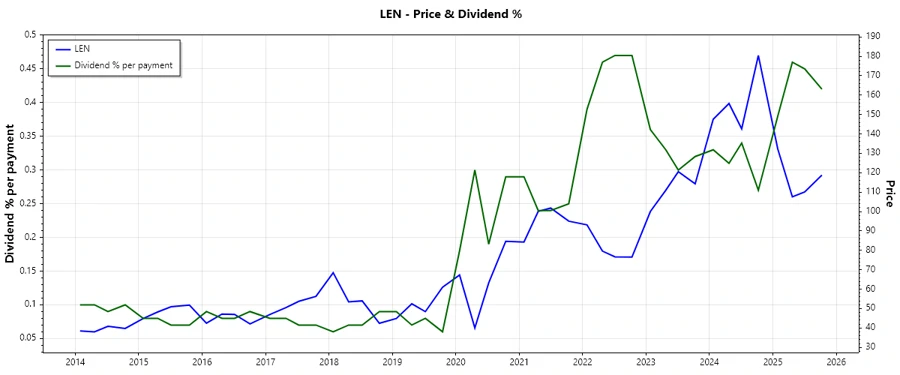
Lennar Corporation operates primarily in the homebuilding sector, presenting a diversified revenue model. Its current dividend yield stands at 1.68%, with a dividend per share of 2.02 USD, signifying a stable income stream for investors. The company boasts an impressive 42-year historical record of dividend payments, underscoring its resilience and commitment to returns, with the last dividend cut occurring in 2009.
| Metric | Value |
|---|---|
| Sector | Homebuilding |
| Dividend yield | 1.68 % |
| Current dividend per share | 2.02 USD |
| Dividend history | 42 years |
| Last cut or suspension | 2009 |
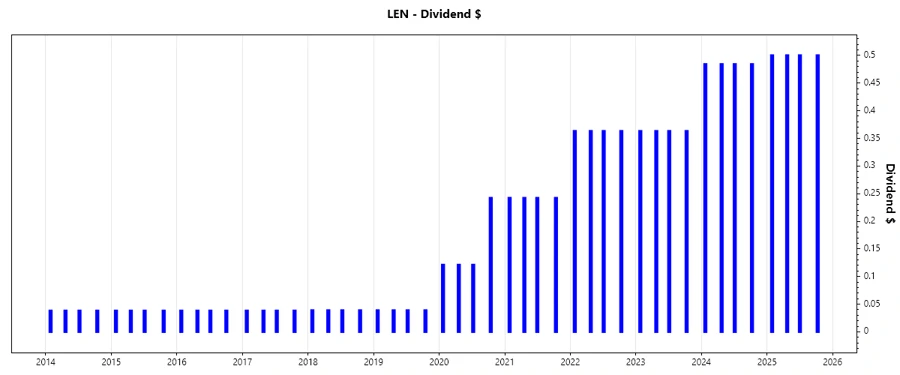
🔍 Dividend History
Lennar's dividend history underscores its commitment to shareholder value, with consistent payments even through economic downturns. This stability is a strong indicator of the company's financial health and capacity to generate consistent cash flows, which are essential for long-term dividend sustainability.
| Year | Dividend Per Share (USD) |
|---|---|
| 2025 | 2.00 |
| 2024 | 1.93612 |
| 2023 | 1.45208 |
| 2022 | 1.45208 |
| 2021 | 0.96804 |
📈 Dividend Growth
The dividend growth is a crucial metric for assessing the future income potential of an investment. Lennar's dividends have grown at an average rate of 0.26% over the past 3 years and 0.66% over the past 5 years, reflecting a pattern of moderate but consistent growth.
| Time | Growth |
|---|---|
| 3 years | 0.26 % |
| 5 years | 0.66 % |
The average dividend growth is 0.66% over 5 years. This shows moderate but steady dividend growth.
📋 Payout Ratio
Payout ratios are indicative of how much of the company's earnings and cash flow are devoted to dividend payments. Lennar maintains a conservative EPS-based payout ratio of 19.21%, signaling low risk of dividend cuts, which highlights its capacity to retain earnings for growth and stability. However, the negative free cash flow-based payout ratio suggests a reliance on non-cash earnings.
| Key figure ratio | Value |
|---|---|
| EPS-based | 19.21 % |
| Free cash flow-based | -72.17 % |
With an EPS payout ratio of 19.21%, Lennar exhibits a sound fiscal policy by safeguarding future growth while rewarding current shareholders. The negative FCF payout demands attention, indicating dependency on non-cash profitability for dividends.
💵 Cashflow & Capital Efficiency
Evaluating cash flow ratios is crucial to understanding liquidity and operational efficiency. Lennar's free cash flow metrics reveal periods of negative cash flow, though earnings yield presents positive. Efficient capital allocation is demonstrated through metrics like CAPEX to Operating Cash Flow, measuring the reinvestment levels for sustainable growth.
| Year | 2024 | 2023 | 2022 |
|---|---|---|---|
| Free Cash Flow Yield | 4.70 % | 14.02 % | 12.60 % |
| Earnings Yield | 8.28 % | 10.87 % | 18.13 % |
| CAPEX to Operating Cash Flow | 7.14 % | 1.93 % | 1.75 % |
| Stock-based Compensation to Revenue | 0.50 % | 0.46 % | 0.55 % |
| Free Cash Flow / Operating Cash Flow Ratio | 92.86 % | 98.07 % | 98.25 % |
Lennar demonstrates strong capital efficiency with high free cash flow ratios, indicative of operational stability. However, negative free cash flows require monitoring.
📉 Balance Sheet & Leverage Analysis
Balance sheet strength and leverage ratios are essential to assess the company's financial stability. Lennar's healthy debt ratios and high coverage ratios reflect a sound financial standing, capable of weathering financial volatility.
| Year | 2024 | 2023 | 2022 |
|---|---|---|---|
| Debt-to-Equity | 15.03 % | 18.75 % | 25.72 % |
| Debt-to-Assets | 10.14 % | 12.70 % | 16.32 % |
| Debt-to-Capital | 13.07 % | 15.79 % | 20.45 % |
| Net Debt to EBITDA | -0.15 | -0.27 | 0.20 |
| Current Ratio | 15.93 | 17.99 | 17.57 |
| Quick Ratio | 4.89 | 6.40 | 5.13 |
| Financial Leverage | 1.48 | 1.48 | 1.58 |
The low debt ratios indicate robust balance sheet strength, suggesting minimal financial risk. Leverage remains at manageable levels, ensuring operational flexibility.
📊 Fundamental Strength & Profitability
Analyzing return metrics and margins provides insight into profitability and operational efficiency. Lennar's consistent returns on equity and assets, alongside stable margins, speak to its effective cost management and value creation for shareholders.
| Year | 2024 | 2023 | 2022 |
|---|---|---|---|
| Return on Equity | 14.11 % | 14.82 % | 19.15 % |
| Return on Assets | 9.52 % | 10.04 % | 12.15 % |
| Return on Invested Capital | 9.28 % | 11.02 % | 14.42 % |
| Net Margin | 11.10 % | 11.50 % | 13.70 % |
| EBIT Margin | 13.68 % | 15.89 % | 20.16 % |
| EBITDA Margin | 14.01 % | 16.21 % | 20.41 % |
| Gross Margin | 15.52 % | 17.35 % | 21.39 % |
The company demonstrates solid profitability with strong returns and expanding margins. The absence of R&D to revenue indicates a mature market focus with reliance on core competencies.
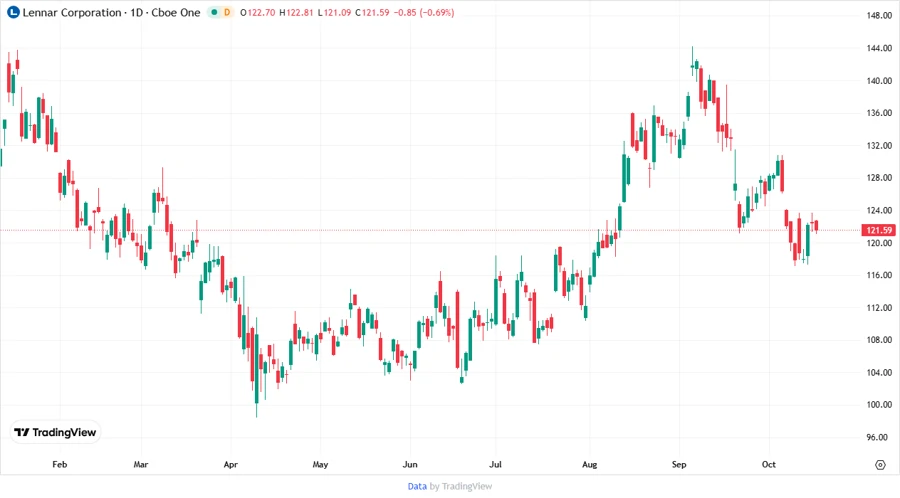
📈 Price Development
📊 Dividend Scoring System
| Criterion | Score | Score Bar |
|---|---|---|
| Dividend Yield | 3 | |
| Dividend Stability | 5 | |
| Dividend Growth | 2 | |
| Payout Ratio | 4 | |
| Financial Stability | 5 | |
| Dividend Continuity | 5 | |
| Cashflow Coverage | 4 | |
| Balance Sheet Quality | 5 |
Total Score: 33/40
✅ Rating
The comprehensive review of Lennar Corporation's dividend attributes reveals a well-rounded and stable investment opportunity. Its long-standing history of dividend payments, backed by solid financial stability, makes it a reliable choice for investors seeking consistent returns. Despite modest growth, the secure payout ratios and strong balance sheet underpin its robustness, earning a high rating for dividend reliability and sustainability.
Smart Data Insight
Master the Perfect Entry & Exit for this Stock
Don't leave your profits to chance. Historically, this stock follows specific seasonal patterns that institutional traders use to maximize returns.
- ✅ Identify the "Golden Buying Window"
- ✅ Avoid high-risk correction cycles
- ✅ Backtested data from the last 20+ years