October 04, 2025 a 02:47 am

LEN: Dividend Analysis - Lennar Corporation
The Lennar Corporation demonstrates a formidable commitment to returning value to shareholders through dividends. With a 42-year history of consistent payouts and a significant focus on financial stability, Lennar stands as a reliable choice for dividend investors. However, its recent payout ratios indicate complexities in cash flow management that necessitate careful monitoring. Given the economic context, its sustainability in maintaining dividend payments is a point of interest for current and potential investors.
📊 Overview
Lennar Corporation operates predominantly within the Real Estate sector, offering a dividend yield of 1.54%. Its current dividend per share stands at $2.02, with a robust 42-year history of uninterrupted dividend payments, marking it as a stalwart in dividend reliability. However, investors should note the history of a last cut or suspension in 2009.
| Sector | Dividend Yield (%) | Current Dividend per Share (USD) | Dividend History (Years) | Last Cut or Suspension |
|---|---|---|---|---|
| Real Estate | 1.54 | 2.02 | 42 | 2009 |
📉 Dividend History
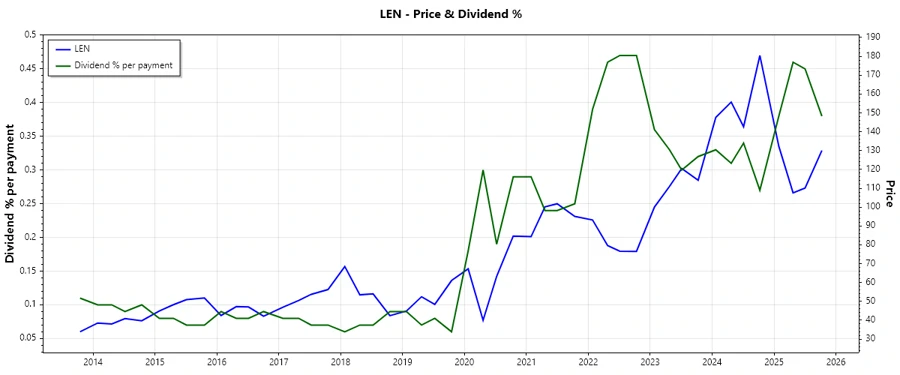
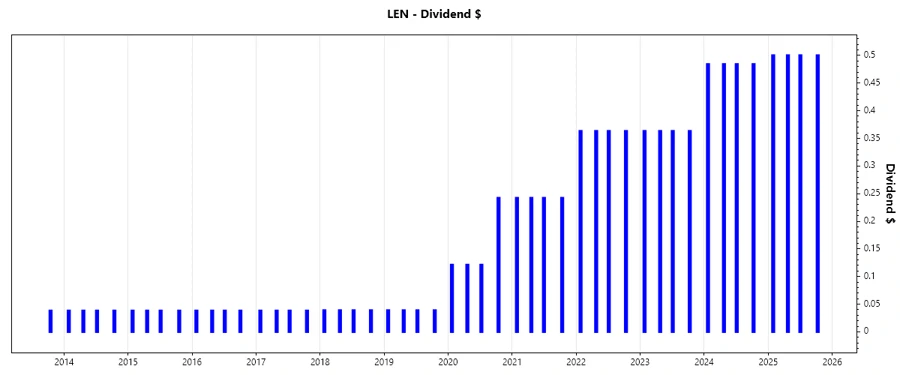
Understanding the historical dividend payments is crucial as it provides insight into the company's past performance and future potential. Lennar has maintained a consistent dividend policy with visible growth over recent years, barring any significant economic downturns.
| Year | Dividend per Share (USD) |
|---|---|
| 2025 | 2.00 |
| 2024 | 1.94 |
| 2023 | 1.45 |
| 2022 | 1.45 |
| 2021 | 0.97 |
📈 Dividend Growth
Dividend growth rates are pivotal for investors seeking not only stable income but also capital appreciation. Lennar's dividend growth over the past 3 and 5 years suggests a deliberate but modest strategy towards increasing shareholder returns.
| Time | Growth (%) |
|---|---|
| 3 years | 26.00% |
| 5 years | 65.72% |
The average dividend growth is 65.72% over 5 years. This shows moderate but steady dividend growth.
✅ Payout Ratio
The payout ratio is a critical metric, indicating how much of a company's earnings are distributed as dividends. Lennar's 19.21% EPS-based payout suggests a conservative approach, allowing for reinvestment and growth, whereas the negative FCF-based payout ratio reflects challenges in free cash flow generation.
| Key Figure | Ratio |
|---|---|
| EPS-based | 19.21% |
| Free Cash Flow-based | -72.33% |
The EPS-based payout is conservative, indicating safety, while the FCF-based figure requires caution as it suggests potential liquidity constraints.
🗣️ Cashflow & Capital Efficiency
Evaluating the cash flow and capital efficiency is essential to gauge the company's operational health and ability to fund dividends sustainably. Lennar's operating metrics exhibit robust capital management; however, a negative free cash flow yield in the latest data indicates potential operational challenges.
| Year | 2024 | 2023 | 2022 |
|---|---|---|---|
| Free Cash Flow Yield | 4.70% | 14.02% | 12.60% |
| Earnings Yield | 8.29% | 10.87% | 18.13% |
| CAPEX to Operating Cash Flow | 7.14% | 1.93% | 1.75% |
| Stock-based Compensation to Revenue | 0.50% | 0.47% | 0.55% |
| Free Cash Flow / Operating Cash Flow Ratio | 92.86% | 98.07% | 98.25% |
The analysis indicates a strong earnings yield, though slightly diminished in 2024. Conversely, the free cash flow may require monitoring for sustainability, particularly if the trend continues.
🗣️ Balance Sheet & Leverage Analysis
Lennar's balance sheet health is assessed via leverage metrics to ensure the sustainability of its financial policies, especially under fluctuating economic conditions.
| Year | 2024 | 2023 | 2022 |
|---|---|---|---|
| Debt-to-Equity | 15.03% | 18.75% | 25.72% |
| Debt-to-Assets | 10.14% | 12.70% | 16.32% |
| Debt-to-Capital | 13.07% | 15.79% | 20.46% |
| Net Debt to EBITDA | -0.15 | -0.27 | 0.21 |
| Current Ratio | 15.93 | 17.99 | 17.57 |
| Quick Ratio | 4.89 | 6.40 | 5.13 |
| Financial Leverage | 1.48 | 1.48 | 1.58 |
The financial metrics highlight robust liquidity, as indicated by high current ratios, and manageable leverage levels. However, a focus on net debt to EBITDA is warranted due to fluctuating values.
🗣️ Fundamental Strength & Profitability
Examining profitability and fundamental strength provides insights into Lennar's long-term viability and competitive market positioning.
| Year | 2024 | 2023 | 2022 |
|---|---|---|---|
| Return on Equity | 14.11% | 14.82% | 19.15% |
| Return on Assets | 9.52% | 10.04% | 12.15% |
| Margins: Net | 11.10% | 11.50% | 13.70% |
| EBIT Margin | 13.68% | 15.89% | 20.16% |
| EBITDA Margin | 14.01% | 16.21% | 20.42% |
| Gross Margin | 15.52% | 17.35% | 21.39% |
| Research & Development to Revenue | 0% | 0% | 0% |
Lennar's ROE and net margins reflect strong profitability. Sustained high gross margins offer competitive advantage but require vigilance on maintaining cost efficiency.
📊 Price Development
Dividend Scoring System
| Criteria | Score | Score Bar |
|---|---|---|
| Dividend Yield | 3 | |
| Dividend Stability | 5 | |
| Dividend Growth | 4 | |
| Payout Ratio | 3 | |
| Financial Stability | 4 | |
| Dividend Continuity | 5 | |
| Cashflow Coverage | 3 | |
| Balance Sheet Quality | 5 |
Overall Score: 32/40
🗣️ Rating
Lennar Corporation's dividend profile exhibits strength in terms of stability and growth potential. With strong financial health and commitment to consistent payouts, Lennar earns a favorable recommendation for conservative dividend-focused portfolios. Careful attention should be paid to its free cash flow management to ensure continued growth in shareholder returns.
Smart Data Insight
Master the Perfect Entry & Exit for this Stock
Don't leave your profits to chance. Historically, this stock follows specific seasonal patterns that institutional traders use to maximize returns.
- ✅ Identify the "Golden Buying Window"
- ✅ Avoid high-risk correction cycles
- ✅ Backtested data from the last 20+ years