July 09, 2025 a 07:46 am


LEN: Dividend Analysis - Lennar Corporation
Lennar Corporation, a leader in the homebuilding sector, has demonstrated a strong commitment to returning value to shareholders through dividends. With a stable dividend history spanning over four decades, the company showcases a solid dividend yield of 2.24% and a current dividend per share of $2.02 USD. Such metrics highlight Lennar's reliability in providing steady income streams to investors, although recent years show modest growth rates.
📊 Overview
Lennar Corporation operates in the residential construction sector, a crucial industry for economic growth. With a solid dividend yield of 2.24% and a history of 42 years in dividend payments, Lennar shows commitment to shareholder returns.
| Metric | Value |
|---|---|
| Sector | Residential Construction |
| Dividend yield | 2.24 % |
| Current dividend per share | $2.02 USD |
| Dividend history | 42 years |
| Last cut or suspension | None |
🗣️ Dividend History
The historical consistency in Lennar's dividend disbursements underlines its operational stability. It reassures investors of predictable payouts, which is pivotal for those relying on dividends as a significant income source.
| Year | Dividend per Share |
|---|---|
| 2025 | $1.50 |
| 2024 | $1.94 |
| 2023 | $1.45 |
| 2022 | $1.45 |
| 2021 | $0.97 |
📈 Dividend Growth
Dividend growth is a crucial indicator of a company's future earnings potential and its ability to increase shareholder value. Lennar shows a 3-year growth rate of 0.26% and a 5-year growth rate of 0.66%.
| Time | Growth |
|---|---|
| 3 years | 26.00 % |
| 5 years | 65.72 % |
The average dividend growth is 65.72% over 5 years. This shows moderate but steady dividend growth.
📊 Payout Ratio
Payout ratios reflect the proportion of earnings paid out as dividends and are a crucial barometer for assessing dividend sustainability.
| Key figure ratio | Value |
|---|---|
| EPS-based | 13.46 % |
| Free cash flow-based | 33.24 % |
The EPS payout ratio of 13.46% and FCF payout ratio of 33.24% are well within safe limits, indicating plenty of room for dividend growth or reinvestment into the company.
📊 Cashflow & Capital Efficiency
Cashflow and capital efficiency analysis offer a window into the operational efficacy and financial health of the company. These metrics impact the company's ability to sustain and grow dividends.
| Year | 2024 | 2023 | 2022 |
|---|---|---|---|
| Free Cash Flow Yield | 4.70 % | 14.02 % | 12.60 % |
| Earnings Yield | 8.29 % | 10.86 % | 18.13 % |
| CAPEX to Operating Cash Flow | 7.14 % | 1.93 % | 1.75 % |
| Stock-based Compensation to Revenue | 0.499 % | 0.469 % | 0.547 % |
| Free Cash Flow / Operating Cash Flow Ratio | 92.86 % | 98.07 % | 98.25 % |
Lennar's cash flow and capital efficiency metrics are strong, supporting its capability to maintain dividend payments and invest in growth opportunities.
📊 Balance Sheet & Leverage Analysis
An analysis of leverage ratios and debt structure provides insight into financial stability and potential risks related to dividend continuity.
| Year | 2024 | 2023 | 2022 |
|---|---|---|---|
| Debt-to-Equity | 15.03 % | 18.75 % | 16.86 % |
| Debt-to-Assets | 10.14 % | 12.70 % | 10.70 % |
| Debt-to-Capital | 13.07 % | 15.79 % | 14.43 % |
| Net Debt to EBITDA | -0.39 | -0.27 | -0.08 |
| Current Ratio | 15.93 | 19.20 | 14.67 |
| Quick Ratio | 4.89 | 7.62 | 4.87 |
| Financial Leverage | 1.48 | 1.48 | 1.58 |
Lennar maintains a strong balance sheet with low leverage ratios, suggesting a stable financial position to support continuous dividend payouts.
📊 Fundamental Strength & Profitability
Fundamental strength and profitability ratios shed light on operational efficiency and profit margins, which are important for future growth and dividend enhancement.
| Year | 2024 | 2023 | 2022 |
|---|---|---|---|
| Return on Equity | 14.11 % | 14.82 % | 19.15 % |
| Return on Assets | 9.52 % | 10.04 % | 12.15 % |
| Margins: Net | 11.10 % | 11.50 % | 13.70 % |
| Margins: EBIT | 13.68 % | 15.89 % | 20.16 % |
| Margins: EBITDA | 14.01 % | 16.21 % | 20.42 % |
| Margins: Gross | 15.52 % | 17.35 % | 21.39 % |
| Research & Development to Revenue | 0.00 % | 0.00 % | 0.00 % |
The strong profitability ratios highlight Lennar's efficient operations, enabling reinvestment in business expansions while rewarding shareholders.
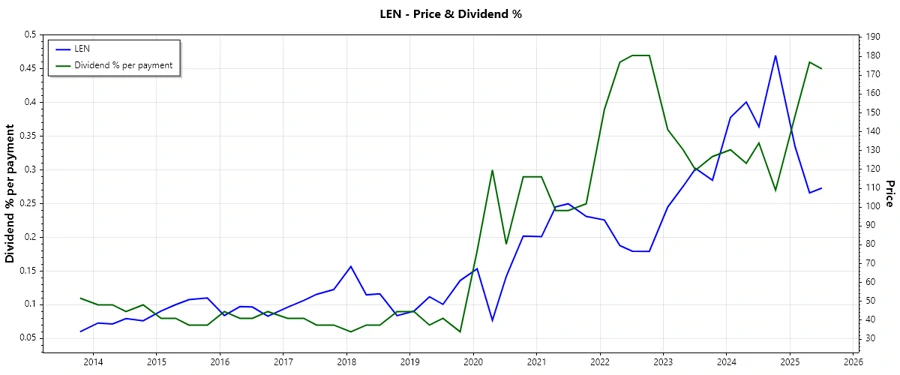
📈 Price Development
📉 Dividend Scoring System
| Category | Rating | Score |
|---|---|---|
| Dividend yield | 4 / 5 | |
| Dividend Stability | 5 / 5 | |
| Dividend growth | 3 / 5 | |
| Payout ratio | 5 / 5 | |
| Financial stability | 4 / 5 | |
| Dividend continuity | 5 / 5 | |
| Cashflow Coverage | 4 / 5 | |
| Balance Sheet Quality | 5 / 5 |
Total Score: 35 / 40
✅ Rating
Lennar Corporation demonstrates a solid dividend profile with a robust history and sustainable payout ratios, making it an attractive option for dividend-focused investors. With strong financial metrics and consistent performance, Lennar should continue to deliver dependable returns, though opportunities for enhanced growth could be pursued.