May 01, 2025 a 09:00 amHier ist die angeforderte Analyse basierend auf den gegebenen Daten für die Kellogg Company (Ticker: K):
K: Trend and Support & Resistance Analysis - Kellogg Company
Kellogg Company shares have shown a relatively stable price movement over the past months, reflecting the company's solid position in the snack and convenience food sector. However, the stock price has faced resistance at higher levels, reflecting cautious investor sentiment. The technical indicators suggest a neutral to slightly downward pressure, indicating potential short-term volatility. Investors should monitor global market trends as macroeconomic factors might impact the demand for Kellogg's products.
Trend Analysis
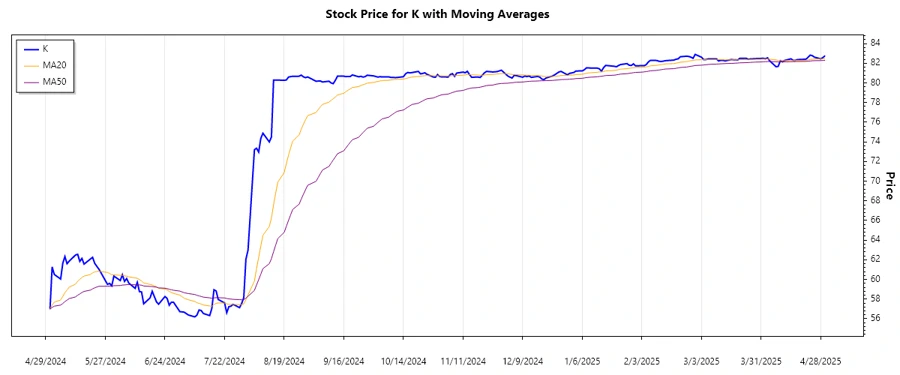
Upon analyzing the stock prices of Kellogg, it becomes evident that the stock has been exhibiting a mostly sideways trend. The EMA20 and EMA50 calculations further enforce this observation, with the two indicators closely converging.
| Date | Close Price | Trend |
|---|---|---|
| April 30, 2025 | 82.77 | ⚖️ |
| April 29, 2025 | 82.58 | ⚖️ |
| April 28, 2025 | 82.44 | ⚖️ |
| April 25, 2025 | 82.62 | ⚖️ |
| April 24, 2025 | 82.77 | ⚖️ |
| April 23, 2025 | 82.83 | ⚖️ |
| April 22, 2025 | 82.60 | ⚖️ |
Given the data, the current market sentiment for Kellogg is neutral, with a potential for stabilization at current levels. This sideways movement suggests a market indecision, awaiting a strong catalyst that could bring directional clarity.
Support and Resistance
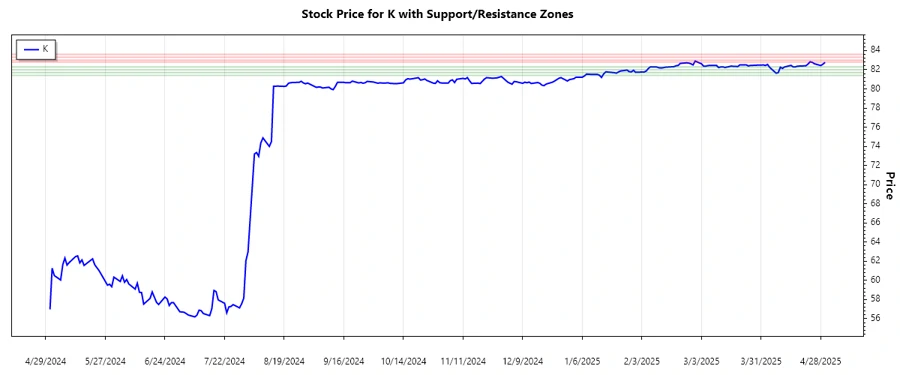
Using the recent closing prices, key support and resistance levels can be identified, which are crucial for traders to make informed decisions.
| Zone | From | To |
|---|---|---|
| Support Zone 1 | ✳️ 82.00 | ✳️ 82.30 |
| Support Zone 2 | ✳️ 81.40 | ✳️ 81.70 |
| Resistance Zone 1 | ⬆️ 82.80 | ⬆️ 83.00 |
| Resistance Zone 2 | ⬆️ 83.30 | ⬆️ 83.60 |
The current price of Kellogg is close to the upper range of the support zones, indicating robust buying interest at these levels. Should prices break above the resistance levels, it might signal a new upward trajectory for the stock.
Conclusion
In conclusion, Kellogg Company appears to be in a period of consolidation, with the stock price hovering around key support and resistance levels. The technical indicators reflect a market in balance, showing that both bullish and bearish sentiments are evenly matched. However, a breakout from current resistance levels could potentially signal an upward move, benefiting long-term holders. Conversely, failure to maintain current support levels may result in downward pressure. Investors should watch for any market developments or company-specific news that might influence future price action.
Smart Data Insight
Master the Perfect Entry & Exit for this Stock
Don't leave your profits to chance. Historically, this stock follows specific seasonal patterns that institutional traders use to maximize returns.
- ✅ Identify the "Golden Buying Window"
- ✅ Avoid high-risk correction cycles
- ✅ Backtested data from the last 20+ years