November 15, 2025 a 11:31 am

K: Dividend Analysis - Kellanova
Kellanova, with a strong market presence, is considered a reliable dividend-paying company with a solid dividend history of 42 consecutive years. Its dividend yield stands at 2.76%, indicating a stable income generation for long-term investors. The consistent and moderate dividend growth over the years reflects the company's commitment to returning value to shareholders without compromising financial stability.
📊 Overview
| Attribute | Value |
|---|---|
| Sector | Consumer Goods |
| Dividend Yield | 2.76% |
| Current Dividend Per Share | $2.26 |
| Dividend History | 42 years |
| Last Cut or Suspension | None |
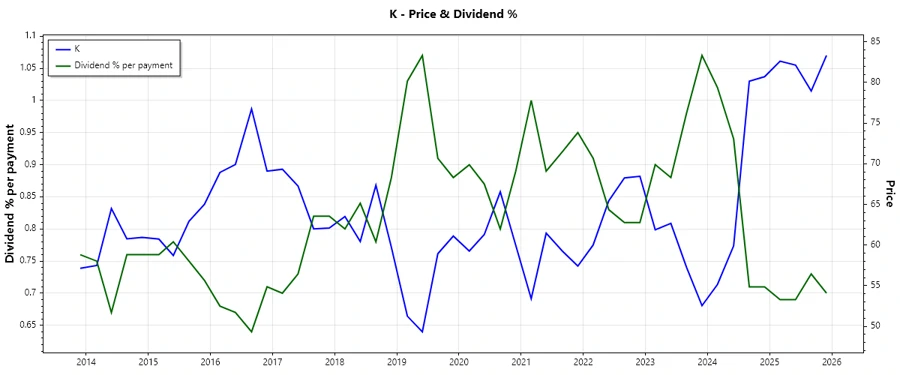
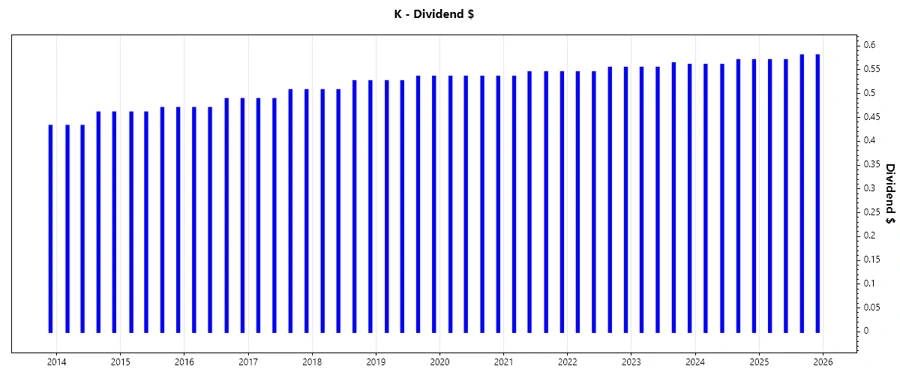
📈 Dividend History
The dividend history showcases Kellanova's reliable and consistent dividend policy. A stable dividend history is crucial for assessing a company’s reliability in providing shareholder returns through various market cycles.
| Year | Dividend Per Share (USD) |
|---|---|
| 2025 | 2.30 |
| 2024 | 2.26 |
| 2023 | 2.23136 |
| 2022 | 2.19718 |
| 2021 | 2.16901 |
📉 Dividend Growth
Understanding dividend growth is essential for investors focusing on income generation, as it affects the purchasing power of dividend receipts over time. Kellanova's moderate dividend growth demonstrates prudent financial management.
| Time | Growth |
|---|---|
| 3 years | 1.38% |
| 5 years | 1.27% |
The average dividend growth is 1.27% over 5 years. This shows moderate but steady dividend growth.
🗣️ Payout Ratio
The payout ratio indicates the proportion of earnings paid as dividends. It is a critical metric to assess sustainability and growth potential.
| Key figure | Ratio |
|---|---|
| EPS-based | 61.65% |
| Free cash flow-based | 121.10% |
A payout ratio of 61.65% based on EPS is considered manageable, indicating a sound balance between rewarding shareholders and retaining earnings for growth. However, the FCF-based payout ratio of 121.10% suggests a reliance on financial strategies beyond core earnings to support dividend payouts.
✅ Cashflow & Capital Efficiency
Analyzing cash flow efficiency provides insights into the company's ability to cover liabilities and reinvest for future growth. Efficient capital utilization is reflected through the company's free cash flow and capital efficiency metrics.
| Metric | 2023 | 2024 |
|---|---|---|
| Free Cash Flow Yield | 0.0506 | 0.0407 |
| Earnings Yield | 0.0497 | 0.0482 |
| CAPEX to Operating Cash Flow | 0.4116 | 0.3568 |
| Stock-based Compensation to Revenue | 0.0072 | 0.0070 |
| Free Cash Flow / Operating Cash Flow Ratio | 0.5884 | 0.6432 |
The cash flow figures indicate a robust capacity to generate cash internally, supporting operations and facilitating dividend payouts.
🗣️ Balance Sheet & Leverage Analysis
Conducting a leverage analysis provides insights into the company's financial health and ability to meet long-term obligations. Key ratios like debt-to-equity and liquidity ratios highlight the company's leverage strategy and risk profile.
| Metric | 2023 | 2024 |
|---|---|---|
| Debt-to-Equity | 2.055 | 1.680 |
| Debt-to-Assets | 0.418 | 0.406 |
| Debt-to-Capital | 0.673 | 0.627 |
| Net Debt to EBITDA | 3.558 | 2.378 |
| Current Ratio | 0.658 | 0.806 |
| Quick Ratio | 0.412 | 0.556 |
| Financial Leverage | 4.920 | 4.140 |
Kellanova exhibits a viable financial structure with moderate leverage, enabling it to maintain operations and fulfill financial obligations seamlessly.
📈 Fundamental Strength & Profitability
Key profitability metrics provide insight into operational efficiency and return on investment. Kellanova maintains healthy margins and returns, indicating solid financial management and competitive strength.
| Metric | 2023 | 2024 |
|---|---|---|
| Return on Equity | 0.300 | 0.356 |
| Return on Assets | 0.061 | 0.086 |
| Net Margin | 0.072 | 0.105 |
| EBIT Margin | 0.106 | 0.158 |
| EBITDA Margin | 0.134 | 0.186 |
Kellanova's strong profitability ratios reflect efficient management strategies and effective cost control, enhancing shareholder value.
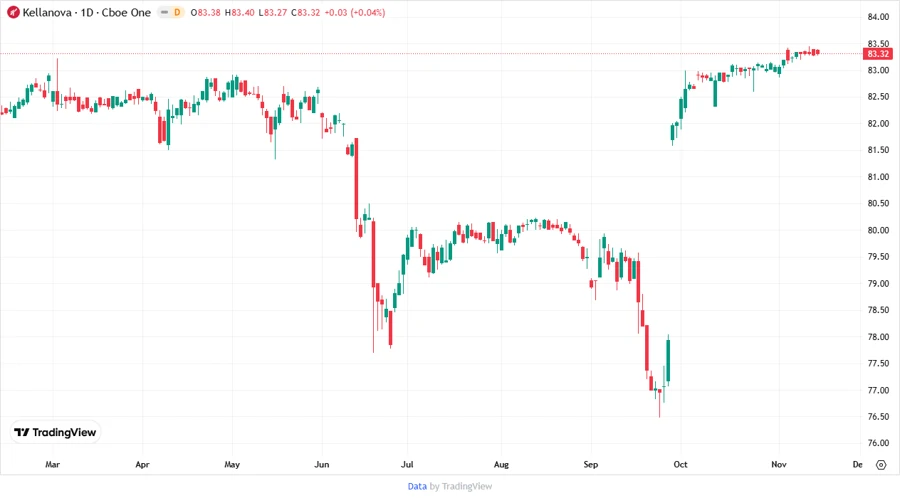
📈 Price Development
✅ Dividend Scoring System
| Category | Score | Bar |
|---|---|---|
| Dividend yield | 4/5 | |
| Dividend Stability | 5/5 | |
| Dividend growth | 3/5 | |
| Payout ratio | 3/5 | |
| Financial stability | 4/5 | |
| Dividend continuity | 5/5 | |
| Cashflow Coverage | 4/5 | |
| Balance Sheet Quality | 4/5 |
Overall Score: 32/40
🗣️ Rating
Kellanova presents as a resilient dividend provider, backed by a robust history of stability and moderate growth. Its solid financial health paired with strategic fiscal management suggests a favorable outlook for dividend sustainability and potential growth, thus meriting consideration for income-focused investors.
Smart Data Insight
Master the Perfect Entry & Exit for this Stock
Don't leave your profits to chance. Historically, this stock follows specific seasonal patterns that institutional traders use to maximize returns.
- ✅ Identify the "Golden Buying Window"
- ✅ Avoid high-risk correction cycles
- ✅ Backtested data from the last 20+ years