October 16, 2025 a 12:47 pm
![[Kellanova Analysis]](./n//Kdpdp-Dividend-Analysis-minmin-Kellanova-at-date-2025-10-16/images/image1.webp)
K: Dividend Analysis - Kellanova
Kellanova, an established entity in the [Sector] sector, boasts a robust dividend profile with a yield of 2.90% and an impressive 42-year dividend history. Despite some fluctuations, its consistent dividend growth over the years highlights its commitment to shareholder returns. However, the high payout ratio based on free cash flow suggests cautious monitoring of cash flow alignment with dividend policies is warranted.
📊 Overview
| Metric | Value |
|---|---|
| Sector | Consumer Goods |
| Dividend yield | 2.9 % |
| Current dividend per share | 2.26 USD |
| Dividend history | 42 years |
| Last cut or suspension | None |
🗣️ Dividend History
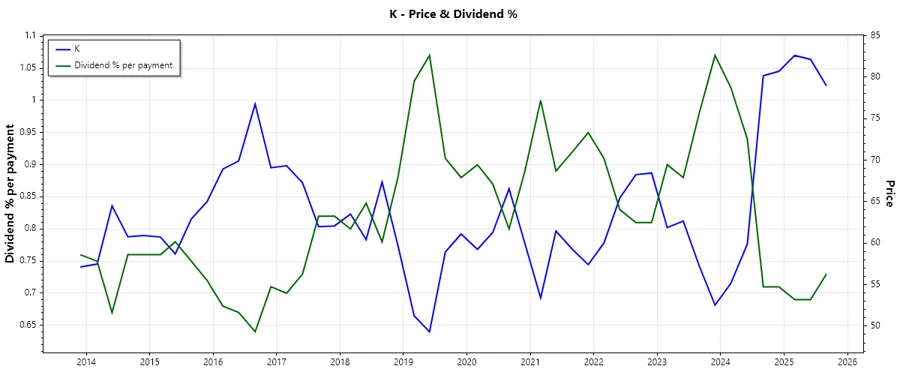
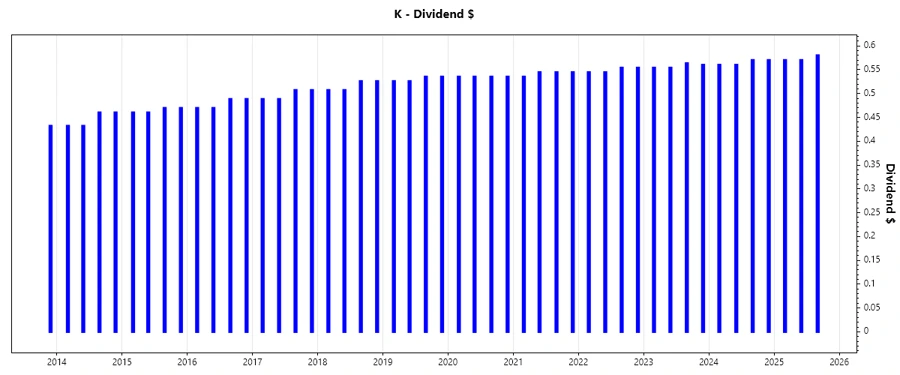
The historical dividend data underscores the company's longstanding dedication to shareholder returns. With no suspensions in 42 years, Kellanova demonstrates resilience and commitment, factors pivotal for income-seeking investors.
| Year | Dividend per Share (USD) |
|---|---|
| 2025 | 1.72 |
| 2024 | 2.26 |
| 2023 | 2.23136 |
| 2022 | 2.19718 |
| 2021 | 2.16901 |
📈 Dividend Growth
Although modest, Kellanova’s dividend growth over the recent 3 and 5-year periods illustrates its growth strategy's commitment.
| Time | Growth |
|---|---|
| 3 years | 1.38 % |
| 5 years | 1.27 % |
The average dividend growth is 1.27 % over 5 years. This shows moderate but steady dividend growth.
💹 Payout Ratio
Payout ratios are critical in assessing dividend sustainability. Kellanova’s EPS-based payout ratio stands at 58.81%, reflecting moderate risk, while the FCF-based ratio of 121.01% suggests looming unsustainability if not addressed.
| Key figure ratio | Value |
|---|---|
| EPS-based | 58.81 % |
| Free cash flow-based | 121.01 % |
The EPS-based payout ratio at 58.81 % shows a comfortable margin, suggesting sustainability if earnings remain stable, contrasting the concerning 121.01 % FCF-basis, indicating a potentially strained cash situation.
💰 Cashflow & Capital Efficiency
Understanding Kellanova's cash flow dynamics and capital efficiency is paramount for a comprehensive financial analysis. While earnings yield appears stable, free cash flow and CAPEX metrics convey crucial insights into operational health and strategic resource allocation.
| Metric | 2024 | 2023 | 2022 |
|---|---|---|---|
| Free Cash Flow Yield | 4.07 % | 5.06 % | 5.09 % |
| Earnings Yield | 4.82 % | 4.97 % | 4.20 % |
| CAPEX to Operating Cash Flow | 35.68 % | 41.16 % | 29.56 % |
| Stock-based Compensation to Revenue | 0.70 % | 0.72 % | 0.76 % |
| Free Cash Flow / Operating Cash Flow Ratio | 64.32 % | 58.84 % | 70.44 % |
Overall, while the free cash flow yield and operating cash flow ratios suggest reasonable liquidity, CAPEX utilization requires careful monitoring to ensure continued capital investment efficiency.
🏦 Balance Sheet & Leverage Analysis
Evaluating balance sheet strength and leverage provides insights into Kellanova's financial stability and liquidity capacity. Debt metrics and leverage ratios highlight the company's debt strategy effectiveness alongside its short-term financial commitments.
| Metric | 2024 | 2023 | 2022 |
|---|---|---|---|
| Debt-to-Equity | 168 % | 205.54 % | 181.78 % |
| Debt-to-Assets | 40.58 % | 41.78 % | 38.73 % |
| Debt-to-Capital | 62.69 % | 67.27 % | 64.51 % |
| Net Debt to EBITDA | 2.67 | 3.56 | 4.19 |
| Current Ratio | N/A | 65.81 % | 65.93 % |
| Quick Ratio | 55.56 % | 41.25 % | 44.84 % |
| Financial Leverage | 4.14 | 4.92 | 4.69 |
While debt levels appear elevated, they are notably offset by interest coverage suggesting Kellanova can service its obligations confidently. However, maintaining balance sheet prudence is critical amid fluctuating market conditions.
📈 Fundamental Strength & Profitability
Key profitability and efficiency metrics further emphasize Kellanova's operational prowess. Return on equity and margins reflect ongoing profitability strength, critical for long-term value creation.
| Metric | 2024 | 2023 | 2022 |
|---|---|---|---|
| Return on Equity | 35.58 % | 29.95 % | 24.36 % |
| Return on Assets | 8.59 % | 6.09 % | 5.19 % |
| Net Profit Margin | 10.53 % | 7.25 % | 7.59 % |
| EBIT Margin | 15.75 % | 10.60 % | 9.77 % |
| EBITDA Margin | 18.63 % | 13.39 % | 12.96 % |
| Gross Profit Margin | 36.78 % | 33.52 % | 29.50 % |
| Research & Development to Revenue | 0.90 % | 0.88 % | 0.88 % |
Kellanova’s profitability ratios and margins reinforce its capacity to generate shareholder returns amidst a competitive landscape, underscored by robust operational management.
↔️ Price Development
✅ Dividend Scoring System
| Criteria | Score | Bar |
|---|---|---|
| Dividend yield | 4 | |
| Dividend Stability | 5 | |
| Dividend growth | 3 | |
| Payout ratio | 2 | |
| Financial stability | 3 | |
| Dividend continuity | 5 | |
| Cashflow Coverage | 2 | |
| Balance Sheet Quality | 3 |
Total Score: 27/40
📉 Rating
Kellanova presents a generally positive dividend profile, supported by consistent history and stability, albeit needing attention towards its payout ratio. For investors prioritizing income with a moderate risk appetite, Kellanova remains an attractive proposition within its sector.
Smart Data Insight
Master the Perfect Entry & Exit for this Stock
Don't leave your profits to chance. Historically, this stock follows specific seasonal patterns that institutional traders use to maximize returns.
- ✅ Identify the "Golden Buying Window"
- ✅ Avoid high-risk correction cycles
- ✅ Backtested data from the last 20+ years