February 02, 2026 a 01:15 pm

KVUE: Trend and Support & Resistance Analysis - Kenvue Inc.
Kenvue Inc., a subsidiary of Johnson & Johnson, engages in the consumer health sector, offering a wide range of products across self-care, skin health, and essential health segments. Despite recent fluctuations in its stock price, Kenvue continues to maintain a stable business model, driven by well-known brands like Tylenol and Neutrogena. This analysis will examine the technical indicators for Kenvue's stock, highlighting recent trends and significant support and resistance zones.
Trend Analysis
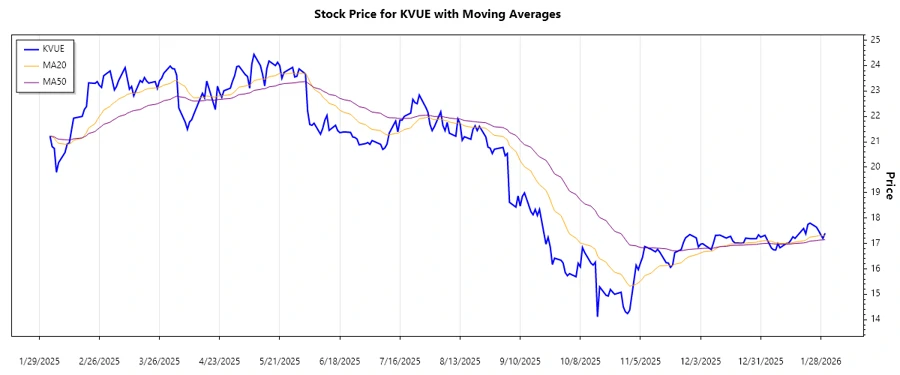
The stock has shown a fluctuating performance over the past months.
| Date | Close Price | Trend |
|---|---|---|
| 2026-01-30 | $17.4 | ▲ Uptrend |
| 2026-01-29 | $17.2 | ▲ Uptrend |
| 2026-01-28 | $17.34 | ▲ Uptrend |
| 2026-01-27 | $17.5 | ▲ Uptrend |
| 2026-01-26 | $17.64 | ▲ Uptrend |
| 2026-01-23 | $17.8 | ▲ Uptrend |
| 2026-01-22 | $17.75 | ▲ Uptrend |
Current analysis shows a consistent uptrend, which might indicate a positive market sentiment towards the stock. The EMA20 crossing above the EMA50 suggests a bullish momentum.
Support and Resistance
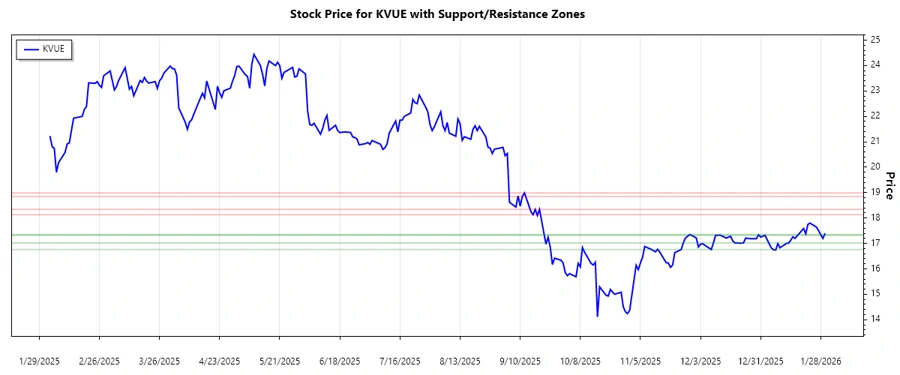
Identifying crucial support and resistance levels can help determine potential reversal or continuation points in the market.
| Zone Type | From | To | Direction |
|---|---|---|---|
| Support | $16.76 | $17.02 | ▲ |
| Support | $17.32 | $17.35 | ▲ |
| Resistance | $18.13 | $18.34 | ▼ |
| Resistance | $18.85 | $18.99 | ▼ |
Currently, the stock is hovering around a resistance zone. Continued upward pressure could break this zone, leading to further gains.
Conclusion
Kenvue Inc. is in a bullish phase, reflected by the rising EMAs and breaches of minor resistance levels. However, investors should remain cautious of the upcoming resistance zones which could pose a challenge. The company's stable market position and solid brand portfolio may be favorable indicators for long-term growth. Nonetheless, fluctuating market conditions warrant vigilance. Market participants should watch for potential buy signals if the breakout above resistance zones is confirmed.