October 30, 2025 a 01:15 pm
KVUE: Trend and Support & Resistance Analysis - Kenvue Inc.
The analysis of Kenvue Inc. reveals a noticeable shift in its price metrics over the examined time frame. As a prominent player in the consumer health sector, Kenvue's stock reflects market sentiments and broader economic conditions. The technical indicators suggest recent momentum and pivotal price zones significant for future trading strategies.
Trend Analysis
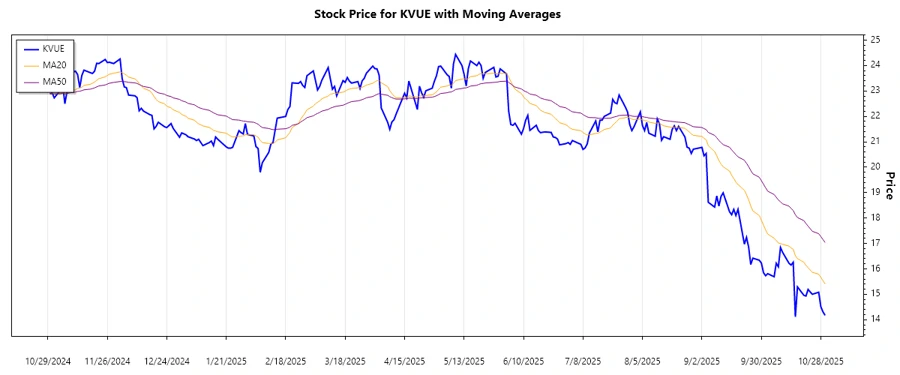
The trend analysis performed for Kenvue Inc. based on EMA calculations provides insights into the stock's current trajectory. The EMA20 and EMA50 are compared to assess the prevailing trend. Recent price movements indicate:
| Date | Closing Price | Trend |
|---|---|---|
| 2025-10-30 | $14.17 | ▼ |
| 2025-10-29 | $14.31 | ▼ |
| 2025-10-28 | $14.51 | ▼ |
| 2025-10-27 | $15.08 | ▼ |
| 2025-10-24 | $15.00 | ▼ |
| 2025-10-23 | $15.09 | ▼ |
| 2025-10-22 | $15.19 | ▼ |
The examination of EMAs suggests a prevailing downward trend, indicating potential further declines unless a reversal pattern emerges.
Support and Resistance
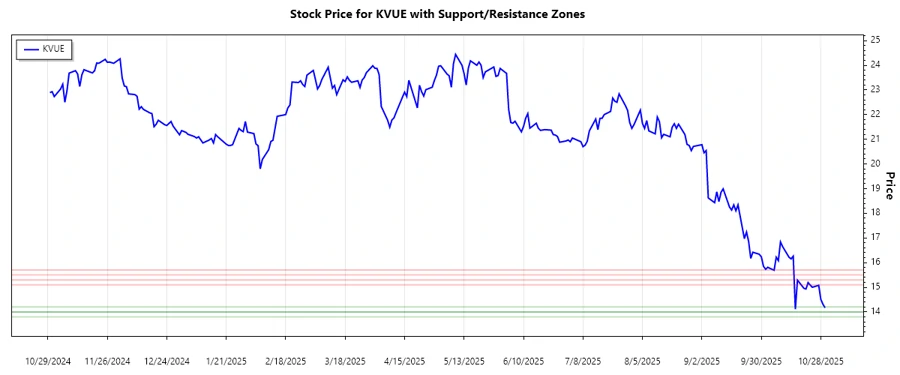
By analyzing Kenvue Inc.'s historical prices, critical support and resistance levels have been derived. The support zones suggest areas of buy interest, whereas resistance zones indicate potential sell interest:
| Zone Type | From | To |
|---|---|---|
| Support | $14.00 | $14.20 |
| Support | $13.80 | $14.00 |
| Resistance | $15.10 | $15.30 |
| Resistance | $15.50 | $15.70 |
Currently, the stock hovers near the lower support zone, suggesting a critical test for future price directions.
Conclusion
The technical analysis of Kenvue Inc. suggests that the stock is under pressure, with current trends indicating a bearish sentiment. Favorable outcomes could arise if critical support levels hold, potentially offering buying opportunities. Analysts should carefully monitor the stock's response to its support zones, as well as any market catalysts that might alter its trajectory. Kenvue's position within the health sector provides a resilient backdrop, but current technical indicators signify the need for caution.
Smart Data Insight
Master the Perfect Entry & Exit for this Stock
Don't leave your profits to chance. Historically, this stock follows specific seasonal patterns that institutional traders use to maximize returns.
- ✅ Identify the "Golden Buying Window"
- ✅ Avoid high-risk correction cycles
- ✅ Backtested data from the last 20+ years