October 04, 2025 a 09:03 am
KR: Trend and Support & Resistance Analysis - The Kroger Co.
The Kroger Co.'s stock has faced significant fluctuations in recent months, showcasing both potential for growth and areas of concern. Investors might find opportunities in the current pricing dynamics, considering the recent trend and proximity to critical price zones. Identifying the current market sentiment surrounding Kroger can provide strategic insights for future investment decisions.
Trend Analysis
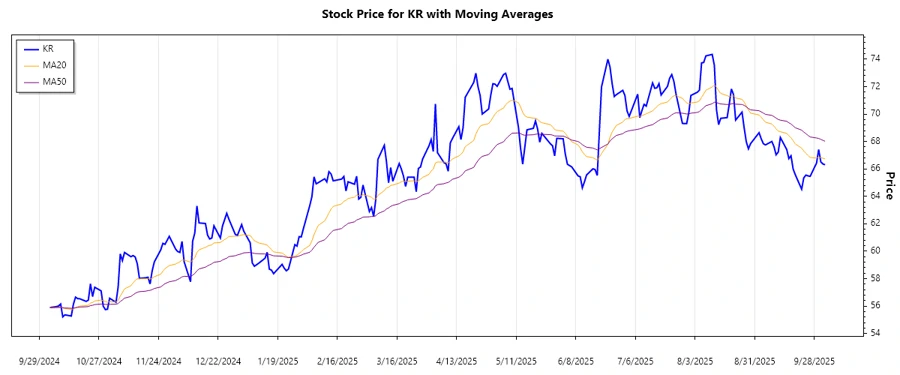
The analysis over the recent months for The Kroger Co. stock indicates a trend predominantly moving downward, with short-term corrections. Trend indicators such as EMA20 and EMA50 provide critical insights into the current direction.
| Date | Close Price | Trend |
|---|---|---|
| 2025-10-03 | 66.30 | ▼ Downtrend |
| 2025-10-02 | 66.36 | ▼ Downtrend |
| 2025-10-01 | 66.51 | ▼ Downtrend |
| 2025-09-30 | 67.41 | ▲ Uptrend |
| 2025-09-29 | 66.43 | ▼ Downtrend |
| 2025-09-26 | 65.46 | ▼ Downtrend |
| 2025-09-25 | 65.49 | ▼ Downtrend |
The current analysis shows a persistent downward trend, suggesting prevailing bearish sentiment. This trend signifies potential resistance from the market towards higher valuations, as reflected by the EMA calculations.
Support and Resistance
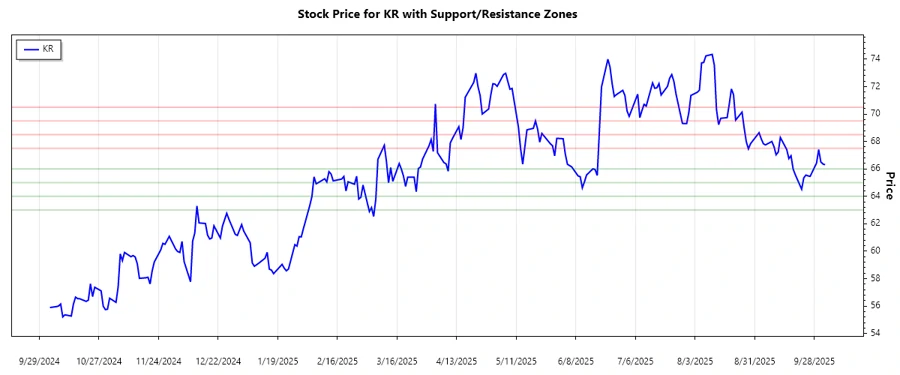
Identifying support and resistance zones plays a key role in understanding the pricing dynamics of Kroger's stock. Here are the identified zones based on recent data:
| Zone Type | From | To |
|---|---|---|
| Support 1 | 65.00 | 66.00 |
| Support 2 | 63.00 | 64.00 |
| Resistance 1 | 67.50 | 68.50 |
| Resistance 2 | 69.50 | 70.50 |
Currently, the stock is hovering near the lower support zone, indicating a potential turning point or further downward movement. Assessing these zones provides a strategic approach for pinpointing buy or sell opportunities.
Conclusion
Investors in The Kroger Co. should be cautious due to the prevailing downtrend and the stock’s position near a support zone, which might indicate a potential bounce or further decline. While the current market sentiment appears bearish, the proximity of the stock to key support zones could attract opportunistic buying if signs of a reversal emerge. Understanding these technical factors is crucial for informed decision-making.
Smart Data Insight
Master the Perfect Entry & Exit for this Stock
Don't leave your profits to chance. Historically, this stock follows specific seasonal patterns that institutional traders use to maximize returns.
- ✅ Identify the "Golden Buying Window"
- ✅ Avoid high-risk correction cycles
- ✅ Backtested data from the last 20+ years