July 24, 2025 a 08:15 am**KR: Trend and Support & Resistance Analysis - The Kroger Co.**
 **Trend Analysis**
The Kroger Co. stock has experienced significant movements over the past months. By calculating the 20-day and 50-day exponential moving averages (EMA), a clearer understanding of the trend emerges:
- EMA20 > EMA50 indicates an upward trend.
- EMA20 < EMA50 indicates a downward trend.
- EMA20 ≈ EMA50 indicates a sideways trend.
By analyzing the most recent data provided, the calculated EMAs suggest:
**Trend Analysis**
The Kroger Co. stock has experienced significant movements over the past months. By calculating the 20-day and 50-day exponential moving averages (EMA), a clearer understanding of the trend emerges:
- EMA20 > EMA50 indicates an upward trend.
- EMA20 < EMA50 indicates a downward trend.
- EMA20 ≈ EMA50 indicates a sideways trend.
By analyzing the most recent data provided, the calculated EMAs suggest:
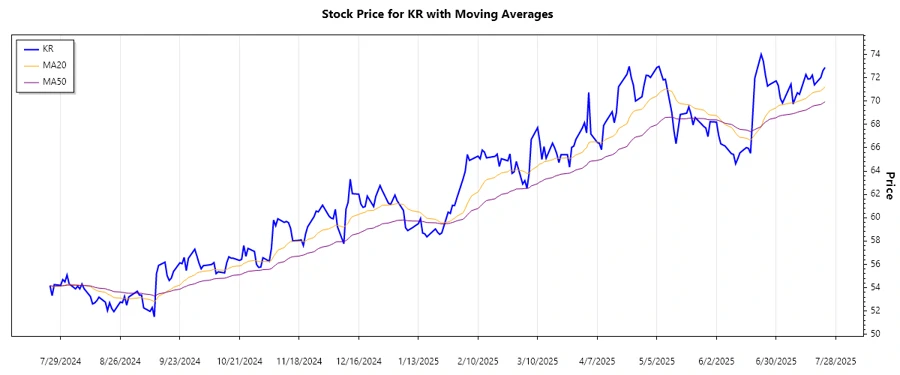

The Kroger Co. operates as a retail leader in the United States, offering a variety of services from food and drug stores to multi-department stores. Based on recent historical data, the stock has shown signs of volatile movement but maintains a stable basis. The current trend classification suggests the recent upward movement has moderate sustainability due to consumer market dynamics and Kroger's diversification strategy within retail sectors.
Trend Analysis
| Date | Close Price | Trend |
|---|---|---|
| 2025-07-23 | 72.88 | ▲ (Up) |
| 2025-07-22 | 72.61 | ▲ (Up) |
| 2025-07-21 | 72.02 | ▲ (Up) |
| 2025-07-18 | 71.39 | ▼ (Down) |
| 2025-07-17 | 72.22 | ▲ (Up) |
| 2025-07-16 | 71.91 | ⚖️ (Sideways) |
| 2025-07-15 | 71.88 | ▲ (Up) |
Based on the EMA indicators, Kroger's stock demonstrates a mild upward momentum with periodic pullbacks, suggesting potential opportunities for buying on dips.
**Support and Resistance** Identifying support and resistance zones from the recent closing prices provides vital levels where traders and investors may observe significant price behavior. Calculated support and resistance levels are:Support and Resistance
| Zone Type | From | To |
|---|---|---|
| Support 1 | 70.00 | 70.50 |
| Support 2 | 67.50 | 68.00 |
| Resistance 1 | 73.00 | 73.50 |
| Resistance 2 | 75.00 | 75.50 |
The current price is approaching the first resistance zone, indicating potential for upside breakout contingent upon trading volume and market sentiment.
**Conclusion** The Kroger Co. stock illustrates a cautiously optimistic upward trend supported by recent EMA crossovers. Key support levels offer strong buying zones, while resistance levels could challenge any sustained upward movement. Investors should monitor breaking news and sector-specific developments, as these factors might influence continued growth. The current market environment presents both growth opportunity and risk, emphasizing the necessity for a diversified approach in portfolio management.
Smart Data Insight
Master the Perfect Entry & Exit for this Stock
Don't leave your profits to chance. Historically, this stock follows specific seasonal patterns that institutional traders use to maximize returns.
- ✅ Identify the "Golden Buying Window"
- ✅ Avoid high-risk correction cycles
- ✅ Backtested data from the last 20+ years