April 20, 2026 a 06:44 am
KR: Fibonacci Analysis - The Kroger Co.
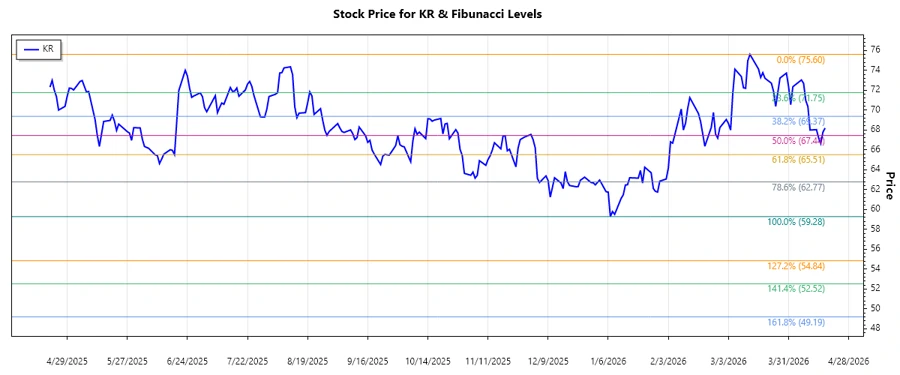
The Kroger Co.'s stock has shown volatility but presents a recognizable long-term trend. Analyzing historical data, it reveals a significant downturn followed by a recent recovery. Considering Kroger's sustained operations in numerous market segments, the price movements resemble cyclic industry patterns. Investors should watch key Fibonacci levels for potential entry points.
Fibonacci Analysis
| Attribute | Details |
|---|---|
| Trend Start Date | 2025-08-11 |
| Trend End Date | 2026-04-17 |
| High Point | $75.60 on 2026-03-13 |
| Low Point | $59.28 on 2026-01-07 |
Fibonacci Retracement Levels
| Retracement Level | Price Level |
|---|---|
| 0.236 | $63.82 |
| 0.382 | $66.61 |
| 0.5 | $67.44 |
| 0.618 | $68.27 |
| 0.786 | $69.32 |
The current price is $68.19, located within the 0.618 retracement zone. This range might act as a strong resistance level, indicating potential short-term price consolidation.
Conclusion
The Kroger Co.'s stock is rallying following a pronounced downtrend, which now registers at significant Fibonacci levels. While the price trades within key retracements, it frequently denotes impending price reversals or consolidations. Analysts should be cautious, as breaking through these levels could identify new trend directions. The company's diversified operations are a stabilizing force amidst market fluctuations. Monitoring economic indicators and consumer trends should aid in forecasting Kroger's future stock performance, bearing both potential opportunities and substantial risks.