February 12, 2026 a 06:44 am
KR: Fibonacci Analysis - The Kroger Co.
The Kroger Co. has recently displayed a strong bearish trend on its stock chart. This reflects potential market challenges despite its strong presence in the grocery and retail sector. Investors should watch for reversal signals, as the current downtrend may yet offer renewed opportunities if the market sentiment shifts.
Fibonacci Analysis
| Detail | Information |
|---|---|
| Trend Start Date | 2025-08-11 |
| Trend End Date | 2026-02-11 |
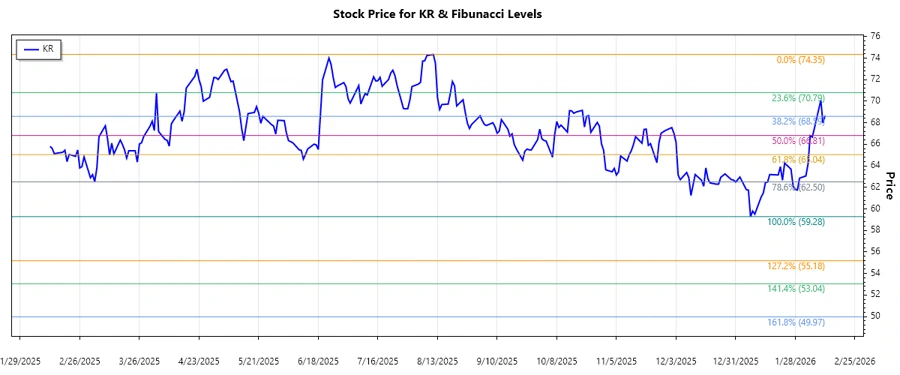
| High Point | $74.35 on 2025-08-11 |
| Low Point | $59.28 on 2026-01-07 |
Fibonacci Levels
| Level | Price |
|---|---|
| 0.236 | $62.71 |
| 0.382 | $64.75 |
| 0.5 | $66.82 |
| 0.618 | $68.88 |
| 0.786 | $71.66 |
The current price of The Kroger Co. is in the 0.236 retracement area, indicating potential support at this level. Traders should watch for signs of either a reversal from this support or further downward movement.
The presence of Fibonacci levels provides clear potential support and resistance zones, crucial for making informed trading decisions.
Conclusion
The Kroger Co.'s recent bearish trend suggests caution for investors looking to enter long positions. However, the presence of robust Fibonacci retracement levels offers structured zones for both support and resistance, potentially providing trading opportunities. Given the dominance of the downtrend observed, further declines could provide even more conducive entry points for long-term investors. Monitoring the current retracement level for sustained price action could reveal possible reversal signals.