October 20, 2025 a 03:15 pm
KR: Fibonacci Analysis - The Kroger Co.
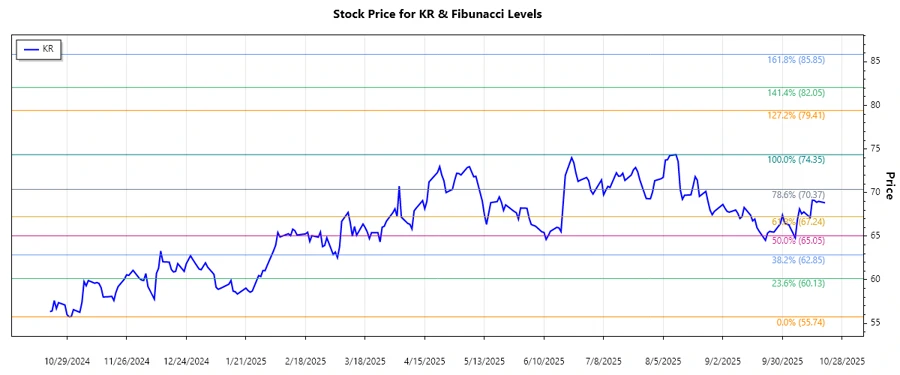
The Kroger Co. stock has been experiencing a dominant upward trend over the past months, marked by significant price movements. This retail giant, with its robust presence across multiple U.S. states, continues to adapt to changing consumer trends, showing resilience in the face of economic shifts. As analysts focus on Fibonacci retracement levels, potential patterns in price corrections are being closely monitored to predict possible price support and resistance levels.
Fibonacci Analysis
| Detail | Information |
|---|---|
| Trend Start Date | 2024-10-31 |
| Trend End Date | 2025-10-20 |
| High Point | 74.35 on 2025-08-11 |
| Low Point | 55.74 on 2024-10-30 |
Fibonacci Retracement Levels
| Retracement Level | Price |
|---|---|
| 0.236 | 64.71 |
| 0.382 | 67.05 |
| 0.5 | 68.93 |
| 0.618 | 70.81 |
| 0.786 | 73.27 |
Currently, the stock price is at 68.825, situating it just below the 0.5 retracement level. This suggests a potential support area that investors should monitor. If the stock bounces back from this level, it could serve as a strong buying signal. Analysts may interpret this technical setup as a possible continuation of the upward trend, depending on significant market conditions.
Conclusion
Kroger Co.'s stock demonstrates a resilient upward trend amidst market volatility. The current price approaching key retracement levels suggests critical zones for potential price support, which savvy investors may capitalize on for a buying interest. However, market fluctuations could influence these technical indicators, requiring prudence and agile decision-making from investors. As the company continues to innovate and expand its retail offerings, the technical indicators signal an optimistic outlook, provided market conditions remain favorable. Nonetheless, macroeconomic factors could present underlying risks in maintaining this trend.
Smart Data Insight
Master the Perfect Entry & Exit for this Stock
Don't leave your profits to chance. Historically, this stock follows specific seasonal patterns that institutional traders use to maximize returns.
- ✅ Identify the "Golden Buying Window"
- ✅ Avoid high-risk correction cycles
- ✅ Backtested data from the last 20+ years