September 29, 2025 a 06:45 am
KR: Fibonacci Analysis - The Kroger Co.
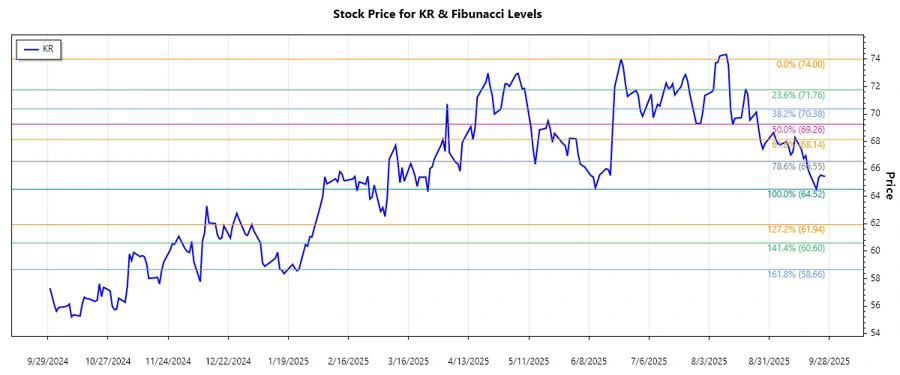
The Kroger Co. stock has shown notable movements recently and is under close watch by investors. Over the past months, the stock has been dominated by a downtrend. Technical indicators suggest potential support areas that may attract bullish interest in the near future.
Fibonacci Analysis
| Attribute | Value |
|---|---|
| Trend Start Date | 2025-06-23 |
| Trend End Date | 2025-09-26 |
| High Price & Date | 74 on 2025-06-23 |
| Low Price & Date | 64.52 on 2025-09-22 |
| Current Price | 65.46 on 2025-09-26 |
| Fibonacci Levels |
|
| Retracement Zone | 0.236 |
| Interpretation | The current price is within the 0.236 retracement level. This may suggest a weak support area, indicating potential for further decline or gradual stabilization before an upswing. |
Conclusion
The Kroger Co.'s recent downtrend offers important insights for technical analysts. While the retracement levels do show some support, the current position within the 0.236 level indicates caution. Investors may need to look for more robust confirmations before considering any long positions. Possible downside risks should be balanced with the company's overall financial health and market environment.
Smart Data Insight
Master the Perfect Entry & Exit for this Stock
Don't leave your profits to chance. Historically, this stock follows specific seasonal patterns that institutional traders use to maximize returns.
- ✅ Identify the "Golden Buying Window"
- ✅ Avoid high-risk correction cycles
- ✅ Backtested data from the last 20+ years