September 12, 2025 a 05:16 am

KR: Fibonacci Analysis - The Kroger Co.
The Kroger Co. has been experiencing a turbulent market environment with notable fluctuations in stock prices over the last few months. As a dominant retailer in the United States, the company showcases resilience through diverse offerings. Recent trends point towards crucial price levels that could indicate future market directions. By analyzing these patterns, investors can make informed decisions based on historical data.
Fibonacci Analysis
| Start Date | End Date | High (Price & Date) | Low (Price & Date) |
|---|---|---|---|
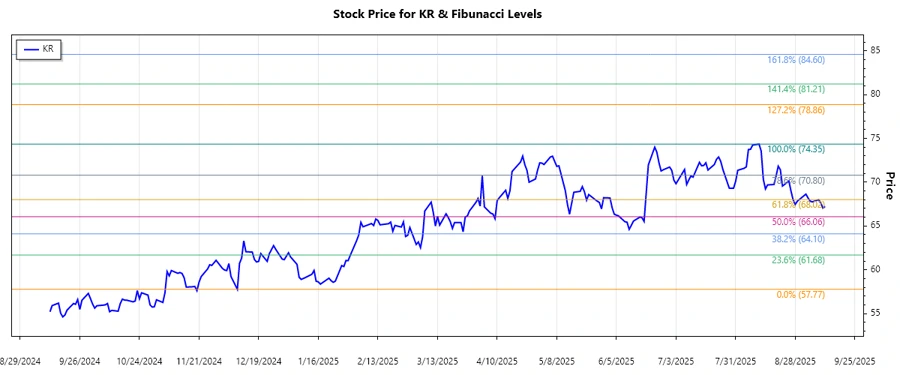
| 2024-12-09 | 2025-09-11 | 74.35 (2025-08-11) | 57.77 (2024-12-09) |
| Fibonacci Level | Price Level |
|---|---|
| 0.236 | 64.97 |
| 0.382 | 67.28 |
| 0.5 | 69.06 |
| 0.618 | 70.84 |
| 0.786 | 73.29 |
Currently, the stock price is in the 0.236 Fibonacci retracement zone, suggesting potential support at lower retracement levels.
This zone acts as a critical level of support, where investors may anticipate a reversal or a continuation of the trend.
Conclusion
The analysis of The Kroger Co.'s stock indicates a significant upward trend from late 2024 to mid-2025. While the stock faces resistance levels as expected from Fibonacci retracement, the current support levels suggest bullish opportunities for investors. Nevertheless, caution is advised, as market conditions can rapidly change. This is an opportunity for analysts to reassess strategy and prepare for potential market volatilities.