April 10, 2026 a 03:31 am

KR: Dividend Analysis - The Kroger Co.
The Kroger Co., with its extensive dividend history, showcases remarkable resilience in the consistently volatile grocery sector. With a market cap of $44.52 billion and a current yield of nearly 2%, it remains a staple for income-focused investors. Its impressive 40 years of unbroken dividend payments highlight the firm's commitment to its shareholders.
📊 Overview
Kroger operates within the Consumer Staples sector, a sector known for defensive stocks with predictable earnings in all economic cycles. This stability is reflected in Kroger's consistent dividend payouts over 40 years. The company currently offers a dividend yield of 1.99%, with a current dividend per share of $1.36 USD.
| Metric | Value |
|---|---|
| Sector | Consumer Staples |
| Dividend Yield | 1.99% |
| Current Dividend per Share | 1.36 USD |
| Dividend History | 40 years |
| Last Cut or Suspension | None |
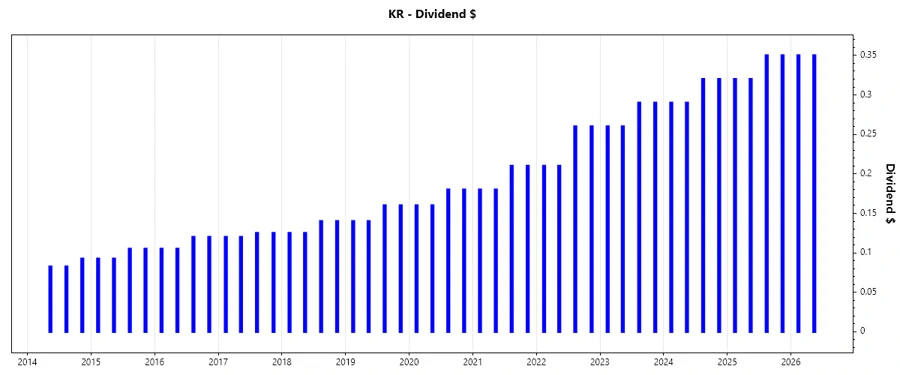
📈 Dividend History
The dividend history of a company is crucial for assessing its stability and commitment to rewarding shareholders. Kroger's ability to maintain dividends through varying economic conditions enhances investor trust. The company provides a reliable stream of income, with its strong history preventing any cuts or suspensions.
| Year | Dividend per Share (USD) |
|---|---|
| 2026 | 0.70 |
| 2025 | 1.34 |
| 2024 | 1.22 |
| 2023 | 1.10 |
| 2022 | 0.94 |
📉 Dividend Growth
Monitoring dividend growth is essential as it reflects the company's ability to maintain paying increments over time. Kroger demonstrates a moderate growth with a 3-year growth rate of 12.54% and a 5-year growth rate of 14.53%. This growth reflects Kroger's attempts to maintain a competitive edge by gradually increasing shareholder returns.
| Time | Growth |
|---|---|
| 3 years | 12.54% |
| 5 years | 14.53% |
The average dividend growth is 14.53% over 5 years. This shows moderate but steady dividend growth.
✅ Payout Ratio
The payout ratio provides insight into whether the company's earnings can support future dividend payments. Kroger's EPS-based payout ratio stands at 84.03%, indicating a generous return of earnings to shareholders. Meanwhile, the FCF-based payout ratio is a more conservative 24.34%, showing the dividend is well covered by actual cash flows.
| Key Figure | Ratio |
|---|---|
| EPS-based | 84.03% |
| Free Cash Flow-based | 24.34% |
The high EPS payout ratio could suggest limited room for further substantial dividend growth unless supported by earnings and cash flow growth. In contrast, a low free cash flow payout ratio signals Kroger can sustain dividends through cash even during tighter earnings periods.
⚠️ Cashflow & Capital Efficiency
Cash flow is critical for operational stability and funding dividends. Kroger's free cash flow yield of 7.93% alongside its earnings yield of 2.30% suggests efficiency in capital utilization. A higher ratio of CAPEX to operating cash flow at 52.2% implies reinvestment and ability to fund future growth.
| Year | 2023 | 2024 | 2025 |
|---|---|---|---|
| Free Cash Flow Yield | 8.71% | 4.03% | 8.18% |
| Earnings Yield | 6.53% | 6.05% | 2.48% |
| CAPEX to Operating Cash Flow | 57.51% | 69.33% | 53.50% |
| Stock-based Compensation to Revenue | 0.11% | 0.12% | 0% |
| Free Cash Flow / Operating Cash Flow Ratio | 42.49% | 30.67% | 46.50% |
The data indicate Kroger maintains a stable cash flow, essential for consistent dividend payments and potential reinvestment to improve capital efficiency.
🔍 Balance Sheet & Leverage Analysis
Evaluating a company's balance sheet and leverage provides insights into its financial stability and risk of insolvency. Despite a high debt-to-equity ratio of 4.16, indicating significant debt reliance, the interest coverage ratio remains acceptable at 2.96.
| Year | 2023 | 2024 | 2025 |
|---|---|---|---|
| Debt-to-Equity | 1.66 | 3.03 | 4.16 |
| Debt-to-Assets | 38.11% | 47.67% | 49.42% |
| Debt-to-Capital | 62.36% | 75.17% | 80.64% |
| Net Debt to EBITDA | 1.99 | 2.49 | 3.67 |
| Current Ratio | 0.81 | 0.96 | 0.80 |
| Quick Ratio | 0.36 | 0.52 | 0.42 |
| Financial Leverage | 4.35 | 6.35 | 8.43 |
These figures reflect Kroger's high leverage but also reveal its efficient asset utilization with substantial financial leverage. Continued profitability and solid cash flows further mitigate liquidity risks.
💪 Fundamental Strength & Profitability
Fundamental strength and profitability metrics shed light on a company's ability to generate profits relative to its peers. Kroger showcases robust return metrics, with a 2024 ROE of 32.17% and margins that suggest efficient operational management.
| Year | 2023 | 2024 | 2025 |
|---|---|---|---|
| Return on Equity | 18.63% | 32.17% | 17.14% |
| Return on Assets | 4.28% | 5.06% | 2.03% |
| Margins: Net | 1.44% | 1.81% | 0.69% |
| EBIT | 3.30% | 3.15% | 1.28% |
| EBITDA | 5.80% | 5.77% | 3.94% |
| Gross | 20.15% | 20.50% | 21.04% |
| Research & Development to Revenue | 0% | 0% | 0% |
Kroger's focus on maintaining competitive profit margins while effectively managing operational costs is mirrored in their return metrics, supporting long-term profitability.
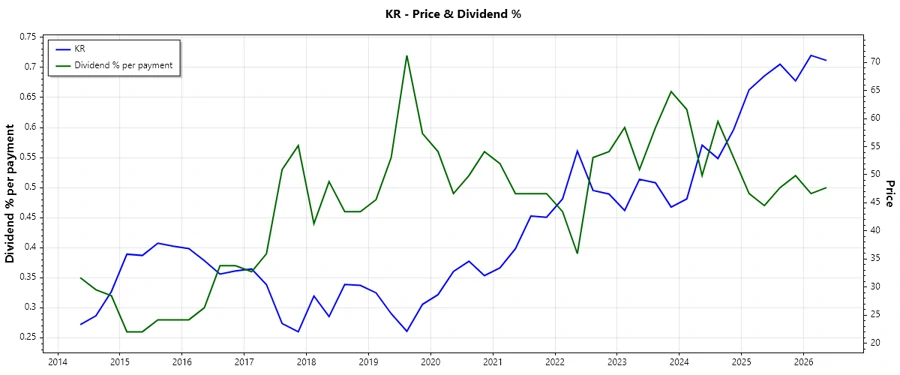
🔄 Price Development
🎯 Dividend Scoring System
| Category | Score | Visual |
|---|---|---|
| Dividend Yield | 3 | |
| Dividend Stability | 5 | |
| Dividend Growth | 4 | |
| Payout Ratio | 3 | |
| Financial Stability | 2 | |
| Dividend Continuity | 5 | |
| Cashflow Coverage | 4 | |
| Balance Sheet Quality | 2 |
Total Score: 28/40
🗣️ Rating
Overall, The Kroger Co. represents a sturdy investment for those seeking steady income through dividends in the Consumer Staples sector. With a well-documented history of stable dividends and moderate growth, Kroger assures its investors of reliable returns, although balance sheet leverage remains a consideration. A final score of 28 out of 40 suggests it remains a particularly strong candidate, especially for risk-adjusted income diversification.
Smart Data Insight
Master the Perfect Entry & Exit for this Stock
Don't leave your profits to chance. Historically, this stock follows specific seasonal patterns that institutional traders use to maximize returns.
- ✅ Identify the "Golden Buying Window"
- ✅ Avoid high-risk correction cycles
- ✅ Backtested data from the last 20+ years