March 08, 2026 a 12:46 pm

KR: Dividend Analysis - The Kroger Co.
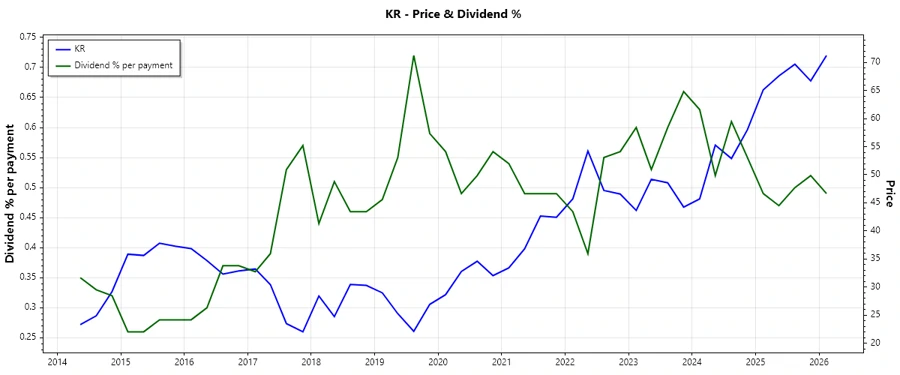
The Kroger Co. has a robust dividend profile with a current dividend yield of 1.92%. With 40 years of uninterrupted dividend payments, the company's commitment to returning value to shareholders is evident. The dividend growth rate over the last 5 years reflects a steady increase, providing confidence in its future disbursements. Investors should, however, be mindful of the high EPS payout ratio.
📊 Overview
The Kroger Co. operates in a stable sector, ensuring a consistent revenue stream that supports its dividend policy. The current dividend yield stands at 1.92%, which, while modest, aligns with the company's strategic growth and capital management plans.
| Sector | Dividend Yield | Current Dividend Per Share | Dividend History | Last Cut or Suspension |
|---|---|---|---|---|
| Retail | 1.92% | 1.36 USD | 40 years | None |
🗣️ Dividend History
The Kroger Co.'s dividend history reflects its stability and dedication to returning profits to shareholders. The company's ability to maintain and grow its dividend over four decades indicates strong operational performance and financial management.
| Year | Dividend Per Share (USD) |
|---|---|
| 2026 | 0.35 |
| 2025 | 1.34 |
| 2024 | 1.22 |
| 2023 | 1.10 |
| 2022 | 0.94 |
📈 Dividend Growth
Analyzing the dividend growth is crucial for understanding potential future returns. Over the last 5 years, Kroger's dividends have grown by approximately 14.53%, indicating a moderate yet reliable growth trend that suggests financial discipline and confidence in future earnings capacity.
| Time | Growth |
|---|---|
| 3 years | 12.54% |
| 5 years | 14.53% |
The average dividend growth is 14.53% over 5 years. This shows moderate but steady dividend growth.
⚠️ Payout Ratio
Payout ratios are essential indicators of dividend sustainability. A high EPS-based payout ratio of 84.03% suggests a significant portion of earnings are distributed as dividends, leaving less room for reinvestment. The FCF-based ratio at 25.49% offers a more comforting margin, indicating better cash flow management.
| Key Figure | Ratio |
|---|---|
| EPS-based | 84.03% |
| Free cash flow-based | 25.49% |
⚒️ Cashflow & Capital Efficiency
The robustness of cash flows and capital efficiency reflects a company's ability to fund dividend payments and reinvest in growth opportunities. Kroger's free cash flow yield and earnings yield indicate a solid return for investors relative to the market value of its equity. A healthy ratio of CAPEX to operating cash flow suggests efficient capital allocation.
| Metric | 2025 | 2024 | 2023 |
|---|---|---|---|
| Free Cash Flow Yield | 8.18% | 4.03% | 8.71% |
| Earnings Yield | 2.48% | 6.05% | 6.53% |
| CAPEX to Operating Cash Flow | 52.21% | 69.33% | 57.51% |
| Stock-based Compensation to Revenue | 0.08% | 0.12% | 0.11% |
| Free Cash Flow / Operating Cash Flow Ratio | 46.50% | 30.67% | 42.49% |
Kroger's cash flow metrics indicate a stable cash position and capital allocation strategy, crucial for sustaining dividends and financing growth.
🔍 Balance Sheet & Leverage Analysis
Analyzing the balance sheet provides insights into a company's financial stability and debt management. Kroger's debt-to-equity and asset ratios highlight significant leverage that requires careful monitoring, although the current and quick ratios suggest adequate short-term liquidity management.
| Metric | 2025 | 2024 | 2023 |
|---|---|---|---|
| Debt-to-Equity | 415.77% | 302.74% | 165.71% |
| Debt-to-Assets | 49.42% | 47.67% | 38.11% |
| Debt-to-Capital | 80.61% | 75.17% | 62.36% |
| Net Debt to EBITDA | 3.67 | 2.76 | 2.47 |
| Current Ratio | 80.20% | 95.82% | 80.63% |
| Quick Ratio | 42.10% | 51.66% | 36.39% |
| Financial Leverage | 8.41 | 6.35 | 4.35 |
Kroger's leverage ratios indicate a high level of indebtedness, which, while common in retail, necessitates careful management to ensure financial flexibility.
📉 Fundamental Strength & Profitability
Profitability metrics offer crucial insights into how effectively a company is generating value for its shareholders. Kroger exhibits a strong return on equity and stable margins, particularly in net and gross categories, indicating efficient cost management and value generation.
| Metric | 2025 | 2024 | 2023 |
|---|---|---|---|
| Return on Equity | 17.12% | 32.17% | 18.63% |
| Return on Assets | 2.03% | 5.06% | 4.28% |
| Margins | Net: 0.69%, EBIT: 1.28%, EBITDA: 3.94%, Gross: 21.04% | Net: 1.81%, EBIT: 2.58%, EBITDA: 5.19%, Gross: 22.70% | Net: 1.44%, EBIT: 2.18%, EBITDA: 4.68%, Gross: 22.24% |
| Research & Development to Revenue | 0% | 0% | 0% |
Kroger's financial performance is characterized by efficient use of its equity and assets, as well as maintaining healthy profit margins. This should continue to support its dividend initiatives.
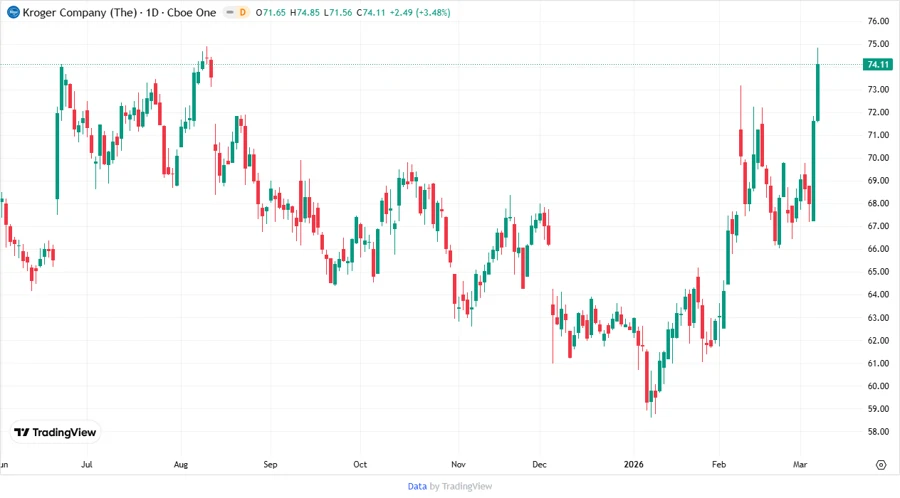
📈 Price Development
🏆 Dividend Scoring System
| Category | Score | Score Bar |
|---|---|---|
| Dividend Yield | 3/5 | |
| Dividend Stability | 4/5 | |
| Dividend Growth | 3/5 | |
| Payout Ratio | 2/5 | |
| Financial Stability | 3/5 | |
| Dividend Continuity | 5/5 | |
| Cashflow Coverage | 3/5 | |
| Balance Sheet Quality | 3/5 |
Total Score: 26/40
✅ Rating
The Kroger Co. demonstrates a solid and reliable dividend strategy that appeals to income investors seeking consistency and modest growth. Its high payout ratio may be a concern, though financial stability is adequately maintained. Monitor the leverage level while considering new investments.