February 06, 2026 a 03:31 pm


KR: Dividend Analysis - The Kroger Co.
The Kroger Co. (KR), with its substantial market presence and robust dividend history spanning over four decades, represents a steady income-producing asset for investors. Boasting a dividend yield of 2.05% and consistent payments, the company highlights its commitment to returning value to shareholders. However, its high payout ratio based on EPS suggests cautious optimism, reflecting the need for ongoing financial scrutiny. Notably, a relatively low FCF payout ratio presents room for sustaining future dividends without pressuring cash flows excessively.
📊 Overview
With a strong foothold in the retail sector, The Kroger Co. offers a modest dividend yield of 2.05%, coupled with a current dividend per share of $1.23. The company's historical focus on consistent dividend payments, maintained for 40 years, reassures investors of its stability. Notably, no recent cuts or suspensions have been reported, reaffirming its status as a reliable dividend payer.
| Parameter | Value |
|---|---|
| Sector | Retail |
| Dividend yield | 2.05% |
| Current dividend per share | $1.23 |
| Dividend history | 40 years |
| Last cut or suspension | None |
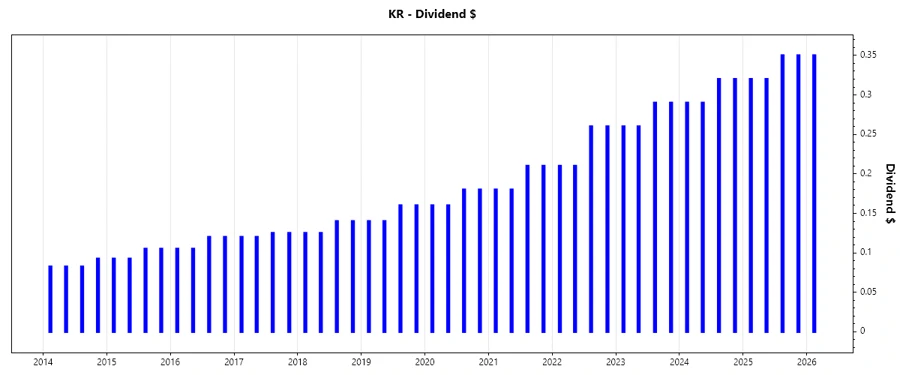
📈 Dividend History
Reviewing the dividend history provides crucial insights into The Kroger Co.’s reliability as a dividend payer. The absence of recent reductions underscores its robust management practices aimed at maintaining investor confidence. Such historical performance, devoid of significant interruptions, indicates potentially lower investment risk in terms of dividend payouts.
| Year | Dividend Per Share (USD) |
|---|---|
| 2026 | 0.35 |
| 2025 | 1.34 |
| 2024 | 1.22 |
| 2023 | 1.10 |
| 2022 | 0.94 |
📈 Dividend Growth
Dividend growth serves as a vital indicator of a company’s capability to enhance shareholder value over the long run. The Kroger Co. records moderate but progressive growth rates, with 12.54% over 3 years and 14.53% over 5 years, underscoring its ability to generate increasing cash flows and profits despite market challenges.
| Time | Growth |
|---|---|
| 3 years | 12.54% |
| 5 years | 14.53% |
The average dividend growth is 14.53% over 5 years. This shows moderate but steady dividend growth, enhancing investor appeal through potential income increments in the future.
✅ Payout Ratio
Payout ratios are crucial for assessing a company’s dividend sustainability. The Kroger Co.’s EPS-based payout ratio stands at 102.52%, signaling potential vulnerability in dividend retainability from earnings. However, the FCF-based payout ratio at 36.40% demonstrates considerable capacity for sustaining payouts even amid earnings volatility.
| Key figure | Ratio |
|---|---|
| EPS-based | 102.52% |
| Free cash flow-based | 36.40% |
A payout ratio above 100% from EPS suggests aggressive distribution strategies that may not be sustainable. However, with a more manageable FCF-based ratio, financial prudence could be afforded to ensure future stability.
💡 Cashflow & Capital Efficiency
Analyzing cash flow metrics provides insight into a firm's operational efficiency and capital utilization. With positive cash flow yields and prudent capex management, The Kroger Co. appears poised to sustain its operational and financial commitments, alongside potential shareholder returns.
| Year | 2024 | 2023 | 2022 |
|---|---|---|---|
| Free Cash Flow Yield | 4.03% | 8.71% | 3.81% |
| Earnings Yield | 6.05% | 6.53% | 6.94% |
| CAPEX to Operating Cash Flow | 69.33% | 57.51% | 71.40% |
| Stock-based Compensation to Revenue | 0.12% | 0.11% | 0.13% |
| Free Cash Flow / Operating Cash Flow Ratio | 30.67% | 42.49% | 28.60% |
While enjoying efficient capital usage, The Kroger Co.'s robust free cash flow generation signifies favorable operational leverage, fostering potential continuity in shareholder return strategies.
📉 Balance Sheet & Leverage Analysis
The company’s leverage ratios reveal a mixed picture of high debt utilization and necessity for diligent balance sheet management. The Debt-to-Equity ratio highlights aggressive leverage strategies, necessitating a focus on sustainable debt management practices.
| Year | 2024 | 2023 | 2022 |
|---|---|---|---|
| Debt-to-Equity | 3.03 | 1.66 | 2.03 |
| Debt-to-Assets | 47.67% | 38.11% | 41.13% |
| Debt-to-Capital | 75.17% | 62.36% | 67.03% |
| Net Debt to EBITDA | 4.01 | 2.47 | 2.76 |
| Current Ratio | 0.96 | 0.81 | 0.74 |
| Quick Ratio | 0.52 | 0.36 | 0.30 |
| Financial Leverage | 6.35 | 4.35 | 4.94 |
A high financial leverage indicates the company's reliance on debt for expansion, necessitating cautious management to ensure long-term financial health and bolster investor confidence.
💪 Fundamental Strength & Profitability
An examination of profitability metrics demonstrates The Kroger Co.'s operational diligence. Consistent returns on equity and assets suggest effective asset utilization, while stable margins facilitate sustaining competitive advantage.
| Year | 2024 | 2023 | 2022 |
|---|---|---|---|
| Return on Equity | 32.17% | 18.63% | 22.35% |
| Return on Assets | 5.06% | 4.28% | 4.52% |
| Net Margin | 1.81% | 1.44% | 1.51% |
| EBIT Margin | 2.58% | 2.18% | 2.32% |
| EBITDA Margin | 5.19% | 4.68% | 4.73% |
| Gross Margin | 22.70% | 22.24% | 21.43% |
| Research & Development to Revenue | 0% | 0% | 0% |
Effective profitability and a solid return on invested capital indicate that The Kroger Co. efficiently utilizes its capital for generating returns, supporting its potential for future growth.
📈 Price Development
🏆 Dividend Scoring System
| Category | Score | Score Bar |
|---|---|---|
| Dividend yield | 3 | |
| Dividend Stability | 5 | |
| Dividend growth | 4 | |
| Payout ratio | 3 | |
| Financial stability | 3 | |
| Dividend continuity | 5 | |
| Cashflow Coverage | 4 | |
| Balance Sheet Quality | 3 |
Overall Score: 30/40
🗣️ Rating
Based on a comprehensive analysis of The Kroger Co.'s dividend characteristics and financial stability, the company maintains a reputable position in dividend investing. Despite some leverage concerns, its sustained dividend growth and history make it an attractive option for conservative investors seeking stable and consistent income. However, investors should monitor leverage ratios and payout sustainability to ensure long-term investment soundness.