November 09, 2025 a 07:46 am

KR: Dividend Analysis - The Kroger Co.
The Kroger Co. remains a steadfast choice for income-focused investors, with a sustainable dividend yield and a robust history of payouts. The company's dividend history of over 39 years highlights its commitment to shareholder returns despite economic fluctuations. As dividend growth continues to reflect moderate gains, Kroger's financial stability provides assurance of future income potential.
📊 Overview
Kroger operates in the Consumer Staples sector, showcasing its reliable and consistent demand even in varied economic conditions. The current dividend yield stands at 2.06%, coupled with a current dividend per share of $1.23. With a historical dividend payment continuity of 39 years and the last recorded cut in 2006, Kroger's dividends signify resilience and commitment.
| Sector | Dividend Yield | Current Dividend Per Share | Dividend History | Last Cut or Suspension |
|---|---|---|---|---|
| Consumer Staples | 2.06% | $1.23 | 39 years | 2006 |
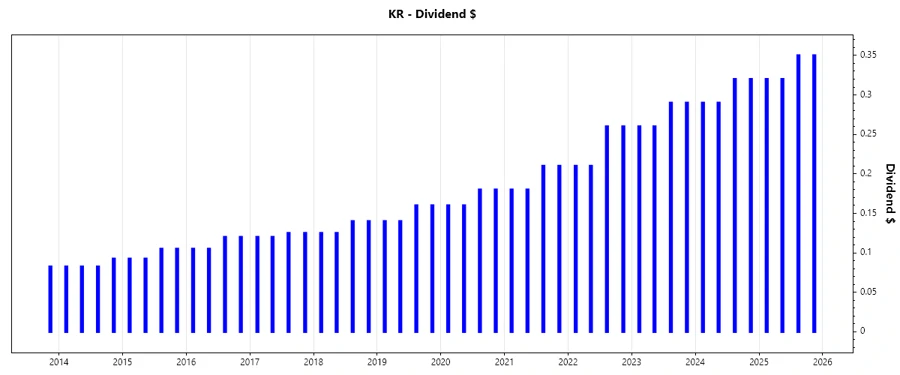
📅 Dividend History
Kroger has consistently increased its dividends, emphasizing reliable income for its investors. Studying the historical trends provides insights into the company's financial health and future dividend sustainability.
| Year | Dividend Per Share (USD) |
|---|---|
| 2025 | 1.34 |
| 2024 | 1.22 |
| 2023 | 1.10 |
| 2022 | 0.94 |
| 2021 | 0.78 |
📈 Dividend Growth
Dividend growth reflects the company's capacity to increase shareholders' wealth over time. It is a critical measure for long-term investors interested in income growth.
| Time | Growth |
|---|---|
| 3 years | 16.08% |
| 5 years | 15.25% |
The average dividend growth is 15.25% over 5 years. This shows moderate but steady dividend growth, indicative of the company's commitment to enhancing shareholder value.
🧮 Payout Ratio
The payout ratio evaluates the portion of earnings distributed as dividends. A sustainable payout ratio indicates the company's capacity to maintain its dividend payments over time.
| Key Figure Ratio |
|---|
| EPS-based: 29.98% |
| Free Cash Flow-based: 36.99% |
An EPS-based payout ratio of 29.98% and a FCF-based ratio of 36.99% suggest that Kroger maintains conservative payout strategies, allowing for reinvestment opportunities and financial flexibility.
💵 Cashflow & Capital Efficiency
Understanding cash flow and capital efficiency is critical to assess the company's ability to meet its financial obligations and reinvest in growth opportunities.
The following table summarizes key metrics over recent years:
| Year | Free Cash Flow Yield | Earnings Yield | CAPEX to Operating Cash Flow | Stock-based Compensation to Revenue | Free Cash Flow / Operating Cash Flow Ratio | Return on Invested Capital |
|---|---|---|---|---|---|---|
| 2024 | 4.03% | 6.05% | 69.33% | 0.12% | 30.67% | 9.87% |
| 2023 | 8.70% | 6.53% | 57.51% | 0.11% | 42.49% | 10.73% |
Kroger's consistent cash flow metrics signify robust operational efficiency and potential for continued capital reinvestment, emphasized by a solid Return on Invested Capital.
🏦 Balance Sheet & Leverage Analysis
Strong financials and managed leverage highlight a company's capacity to sustain financial obligations while funding growth and operations.
| Year | Debt-to-Equity | Debt-to-Assets | Debt-to-Capital | Net Debt to EBITDA | Current Ratio | Quick Ratio |
|---|---|---|---|---|---|---|
| 2024 | 3.03 | 47.67% | 75.17% | 2.76 | 0.96 | 0.52 |
| 2023 | 1.66 | 38.11% | 62.36% | 2.47 | 0.81 | 0.36 |
Kroger displays strong financial management with effective leverage ratios, underlining its capacity to manage debts and operational costs efficiently.
📊 Fundamental Strength & Profitability
Analyzing profitability ratios offers insights into operational efficiency and the company's potential to generate profits from its assets and equity.
| Year | Return on Equity | Return on Assets | EBIT Margin | EBITDA Margin | Gross Margin | R&D to Revenue |
|---|---|---|---|---|---|---|
| 2024 | 32.17% | 5.06% | 2.58% | 5.20% | 20.50% | 0% |
| 2023 | 18.63% | 4.28% | 2.19% | 4.69% | 20.15% | 0% |
Kroger's effective use of resources is reflected in its robust return on equity and steadily maintained profit margins, evidencing efficient cost management and revenue generation capabilities.
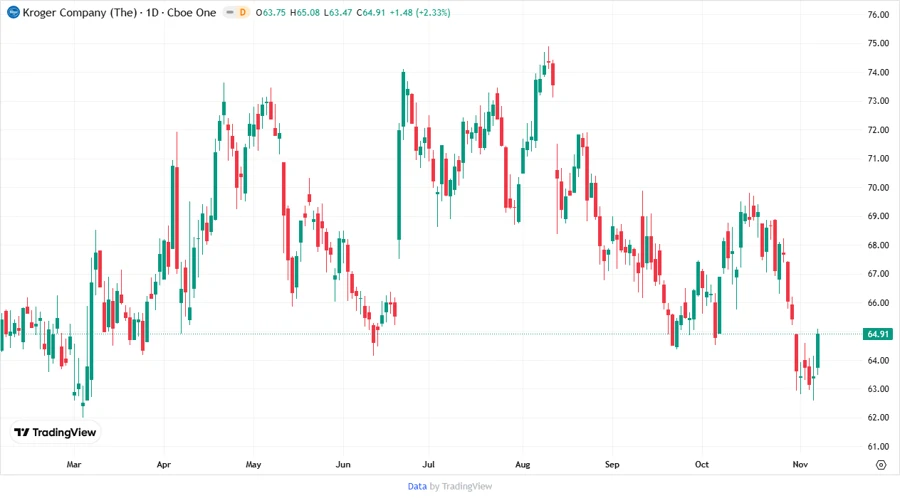
📈 Price Development
⭐ Dividend Scoring System
| Criteria | Score | Bar |
|---|---|---|
| Dividend yield | 4 | |
| Dividend stability | 5 | |
| Dividend growth | 4 | |
| Payout ratio | 4 | |
| Financial stability | 3 | |
| Dividend continuity | 5 | |
| Cashflow coverage | 3 | |
| Balance sheet quality | 4 |
Total Score: 32/40
🏅 Rating
The Kroger Co. receives a strong dividend rating due to its solid yield, stability, and reliable growth trajectory. Investors seeking steady income and modest appreciation may find Kroger an attractive addition to their portfolios, supported by its resilient business model and financial discipline.
Smart Data Insight
Master the Perfect Entry & Exit for this Stock
Don't leave your profits to chance. Historically, this stock follows specific seasonal patterns that institutional traders use to maximize returns.
- ✅ Identify the "Golden Buying Window"
- ✅ Avoid high-risk correction cycles
- ✅ Backtested data from the last 20+ years