August 09, 2025 a 02:47 am
KR: Dividend Analysis - The Kroger Co.
The Kroger Co. offers a reliable dividend profile with a consistent dividend history spanning over 39 years. The company's moderate dividend yield, coupled with its steady dividend growth over 3 and 5 years, reflects a robust dividend strategy. The sustainable payout ratio and healthy financial metrics further consolidate its standing as a dependable dividend-paying stock.
📊 Overview
The Kroger Co. operates within the Retail sector, showcasing a stable dividend yield of 1.76%. The current dividend per share is $1.23, indicating solid shareholder returns. This company boasts a 39-year uninterrupted dividend history, demonstrating a commitment to maintaining dividend consistency. There has been no recent cut or suspension, reinforcing investor confidence.
| Metric | Value |
|---|---|
| Sector | Retail |
| Dividend yield | 1.76% |
| Current dividend per share | 1.23 USD |
| Dividend history | 39 years |
| Last cut or suspension | None |
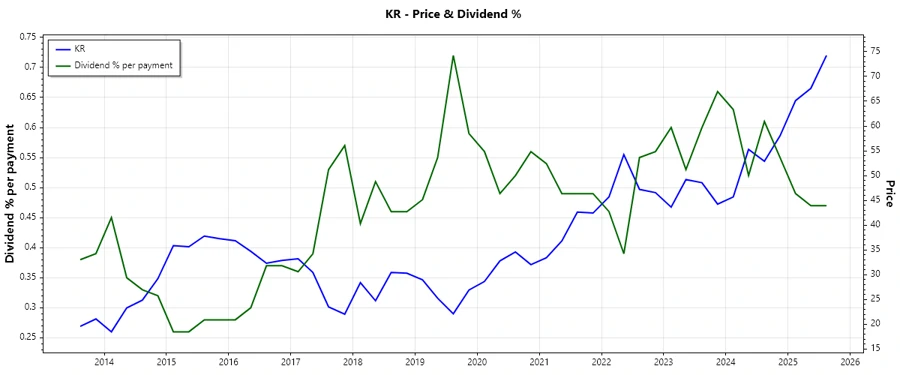
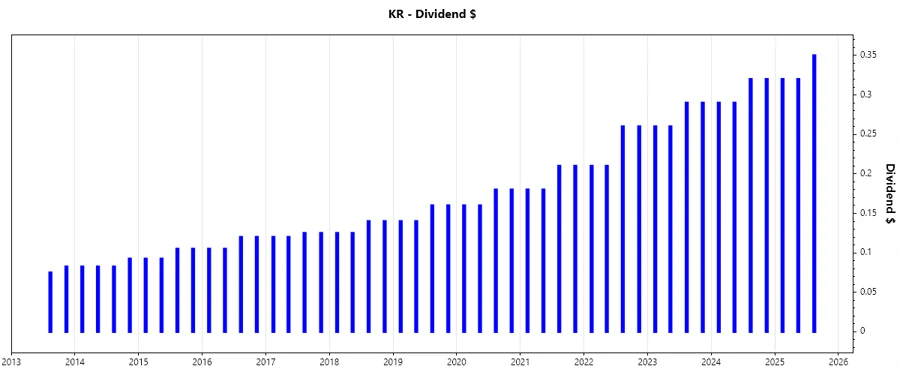
🗣️ Dividend History
An analysis of The Kroger Co.'s dividend history reveals resilient payouts over decades, highlighting their ability to maintain financial health through diverse market conditions. This long-term consistency is crucial for investors seeking stable income.
| Year | Dividend per Share (USD) |
|---|---|
| 2025 | 0.99 |
| 2024 | 1.22 |
| 2023 | 1.10 |
| 2022 | 0.94 |
| 2021 | 0.78 |
📈 Dividend Growth
The company has shown dividend growth of 16.08% over the last 3 years and 15.25% over the last 5 years. Such growth patterns are indicative of management's commitment to enhancing shareholder value sustainably over time.
| Time | Growth |
|---|---|
| 3 years | 16.08% |
| 5 years | 15.25% |
The average dividend growth is 15.25% over 5 years. This shows moderate but steady dividend growth.
✅ Payout Ratio
A critical assessment of the payout ratios reveals a disciplined approach. An EPS-based payout ratio of 31.54% and a FCF-based ratio of 44.28% indicate well-managed dividend policies, ensuring they remain sustainable and well-covered by earnings and cash flows.
| Key Figure | Ratio |
|---|---|
| EPS-based | 31.54% |
| Free cash flow-based | 44.28% |
The EPS payout ratio is considered healthy, reflecting The Kroger Co.'s capacity to reinvest in growth while maintaining rewarding dividends.
💵 Cashflow & Capital Efficiency
The cash flow analysis provides insights into The Kroger Co.’s operational efficiency and capital deployment strategies. Impressively, the Free Cash Flow Yield stands at a favorable 3.76%, signifying robust cash generation relative to the market capitalization.
| Year | 2024 | 2023 | 2022 |
|---|---|---|---|
| Free Cash Flow Yield | 4.03% | 8.71% | 3.81% |
| Earnings Yield | 6.05% | 6.53% | 6.94% |
| CAPEX to Operating Cash Flow | 0.69 | 0.58 | 0.71 |
| Stock-based Compensation to Revenue | 0.12% | 0.11% | 0.13% |
| Free Cash Flow/Operating Cash Flow Ratio | 0.31 | 0.42 | 0.29 |
The company maintains a commendable operational cash flow coverage ratio, underscoring its proficiency in utilizing capital to generate consistent earnings.
📝 Balance Sheet & Leverage Analysis
The leverage analysis underscores The Kroger Co.’s strategic handling of debt. A reasonable net debt to EBITDA ratio of around 2.66 suggests manageable leverage without undermining its financial health.
| Year | 2024 | 2023 | 2022 |
|---|---|---|---|
| Debt-to-Equity | 3.03 | 1.66 | 2.03 |
| Debt-to-Assets | 0.48 | 0.38 | 0.41 |
| Debt-to-Capital | 0.75 | 0.62 | 0.67 |
| Net Debt to EBITDA | 2.76 | 2.47 | 2.76 |
| Current Ratio | 0.95 | 0.81 | 0.74 |
| Quick Ratio | 0.52 | 0.36 | 0.30 |
| Financial Leverage | 6.35 | 4.35 | 4.93 |
The ratios exhibit a robust balance sheet structure with sustainable leverage and strong liquidity management.
🧮 Fundamental Strength & Profitability
The profitability indicators such as Return on Equity and Net Margin are fundamental for gauging The Kroger Co.'s market competitiveness and efficiency in leveraging assets to generate profits. A consistent ROE enhances investor confidence.
| Year | 2024 | 2023 | 2022 |
|---|---|---|---|
| Return on Equity | 32.17% | 18.63% | 22.35% |
| Return on Assets | 5.06% | 4.28% | 4.53% |
| Margins: Net | 1.81% | 1.44% | 1.51% |
| Margins: EBIT | 2.58% | 2.18% | 2.32% |
| Margins: EBITDA | 5.19% | 4.69% | 4.74% |
| Gross | 22.70% | 22.24% | 21.43% |
| R&D to Revenue | 0.00% | 0.00% | 0.00% |
The Kroger Co.'s strategic management and operational efficiencies are reflected in their superior profit margins and returns.
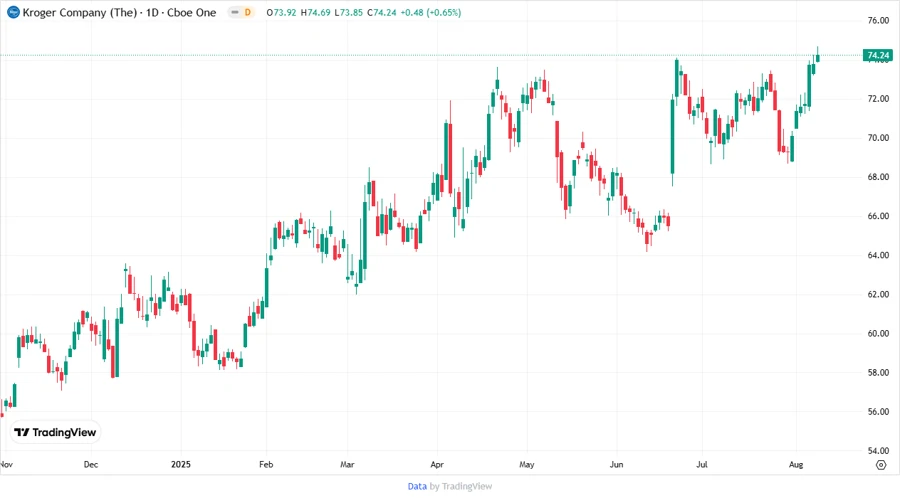
📉 Price Development
The current price developments emphasize the market's positive response to The Kroger Co.’s operational success and financial strategies, impacting investor sentiment favorably.
🎯 Dividend Scoring System
| Criteria | Score | |
|---|---|---|
| Dividend yield | 3 | |
| Dividend Stability | 5 | |
| Dividend growth | 4 | |
| Payout ratio | 4 | |
| Financial stability | 4 | |
| Dividend continuity | 5 | |
| Cashflow Coverage | 4 | |
| Balance Sheet Quality | 4 |
Total Score: 33/40
📉 Rating
The Kroger Co. exhibits strong dividend fundamentals and a promising financial outlook, warranting a positive recommendation for income-focused investors. Its disciplined payout strategy and robust financial position reinforce its status as a reliable dividend investment.
Smart Data Insight
Master the Perfect Entry & Exit for this Stock
Don't leave your profits to chance. Historically, this stock follows specific seasonal patterns that institutional traders use to maximize returns.
- ✅ Identify the "Golden Buying Window"
- ✅ Avoid high-risk correction cycles
- ✅ Backtested data from the last 20+ years