August 03, 2025 a 11:32 am
📊 KR: Dividend Analysis - The Kroger Co.
The Kroger Co. represents a compelling dividend investment opportunity with its strong track record of consistent payouts. Despite its current dividend yield of 1.84%, which might seem modest, Kroger's 39 years of uninterrupted dividend history showcases its commitment to shareholders. The company has prudently managed its earnings, maintaining a conservative payout ratio while still providing moderate dividend growth, reinforcing both stability and potential for future dividend enhancements.
🗣️ Overview
Kroger operates in the highly competitive retail sector, effectively leveraging its market position to sustain dividends. Its current yield of 1.84% and a recent dividend per share of $1.23 emphatically highlight its resilience. Kroger's impressive 39-year track record of consistent dividend payments, devoid of any cuts or suspensions, underscores a robust financial strategy committed to shareholder value.
| Category | Details |
|---|---|
| Sector | Retail |
| Dividend yield | 1.84% |
| Current dividend per share | $1.23 |
| Dividend history | 39 years |
| Last cut or suspension | None |
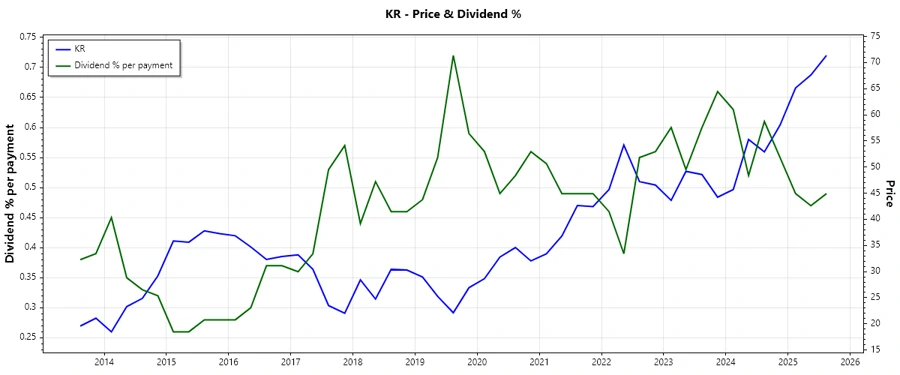
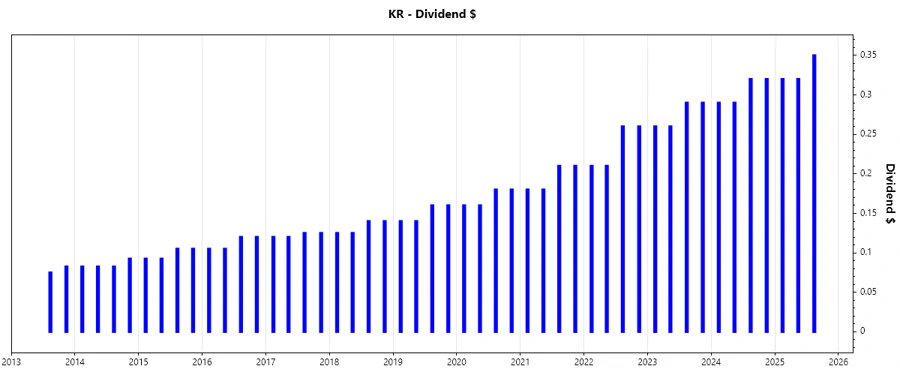
📈 Dividend History
The historical trajectory of Kroger's dividend payments is a testament to its consistent approach, crucial for income-focused investors seeking reliability. Over recent years, the company has persistently increased its dividends, reflecting robust financial health and strategic foresight.
| Year | Dividend per Share (USD) |
|---|---|
| 2025 | $0.99 |
| 2024 | $1.22 |
| 2023 | $1.10 |
| 2022 | $0.94 |
| 2021 | $0.78 |
📉 Dividend Growth
The trajectory of Kroger's dividend growth is a crucial metric for evaluating its future potential. Over the past 3 and 5 years, Kroger has demonstrated a growth rate of approximately 16.08% and 15.25% respectively. Such growth underlines the company's capacity for sustaining and potentially enhancing dividend payouts, reinforcing its attractiveness to investors.
| Time | Growth |
|---|---|
| 3 years | 16.08% |
| 5 years | 15.25% |
The average dividend growth is 15.25% over 5 years. This shows moderate but steady dividend growth, indicative of fiscal prudence and forward-looking strategies.
✅ Payout Ratio
Kroger's payout ratios are indicative of effective earnings and cash flow management. Maintaining an EPS-based payout ratio of 31.54% and an FCF-based ratio of 47.72%, the company reflects a conservative approach that ensures dividend sustainability while allowing room for operational reinvestments.
| Key figure | Ratio |
|---|---|
| EPS-based | 31.54% |
| Free cash flow-based | 47.72% |
These payout ratios highlight Kroger's ability to uphold dividends comfortably without compromising on capital efficiency or growth investments.
Cashflow & Capital Efficiency
Evaluating cash flow and capital efficiency metrics provides insights into Kroger's operational prowess and capital allocation. These figures illuminate the company's adeptness in balancing expenditures with cash inflows, underpinning its financial robustness.
| Year | 2024 | 2023 | 2022 |
|---|---|---|---|
| Free Cash Flow Yield | 4.03% | 8.71% | 3.81% |
| Earnings Yield | 6.05% | 6.53% | 6.94% |
| CAPEX to Operating Cash Flow | 69.33% | 57.51% | 71.40% |
| Stock-based Compensation to Revenue | 0.12% | 0.11% | 0.13% |
| Free Cash Flow / Operating Cash Flow Ratio | 30.67% | 42.49% | 28.60% |
Kroger's financial indicators denote a solid balance between revenue generation and capital reinvestment, fostering long-term sustainability and shareholder returns.
Balance Sheet & Leverage Analysis
A comprehensive balance sheet and leverage analysis provides crucial insights into Kroger's financial health and risk profile. These metrics assess the firm's liquidity, leverage, and solvency, exhibiting its ability to manage debts and assets prudently.
| Year | 2024 | 2023 | 2022 |
|---|---|---|---|
| Debt-to-Equity | 3.03 | 1.66 | 2.04 |
| Debt-to-Assets | 47.67% | 38.11% | 41.21% |
| Debt-to-Capital | 75.17% | 62.36% | 67.09% |
| Net Debt to EBITDA | 2.76 | 2.47 | 2.76 |
| Current Ratio | 0.96 | 0.81 | 0.74 |
| Quick Ratio | 0.52 | 0.36 | 0.30 |
| Financial Leverage | 6.35 | 4.35 | 4.95 |
These ratios articulate Kroger's leverage dynamics and liquidity status, affirming its strategic use of debt in augmenting growth while maintaining financial stability.
Fundamental Strength & Profitability
Assessing fundamental strength and profitability offers crucial insights into the firm's financial performance. These indicators reflect Kroger's capacity to generate returns and sustain profitability in competitive markets.
| Year | 2024 | 2023 | 2022 |
|---|---|---|---|
| Return on Equity | 32.17% | 18.63% | 22.41% |
| Return on Assets | 5.06% | 4.28% | 4.53% |
| Margins (Net) | 1.81% | 1.44% | 1.51% |
| Margins (EBIT) | 2.58% | 2.18% | 2.32% |
| Margins (EBITDA) | 5.19% | 4.69% | 4.74% |
| Gross Margins | 22.70% | 22.24% | 21.43% |
| R&D to Revenue | 0% | 0% | 0% |
Kroger's profit margins and return metrics point to a sound operational framework securing a competitive edge and capable of driving long-term growth.
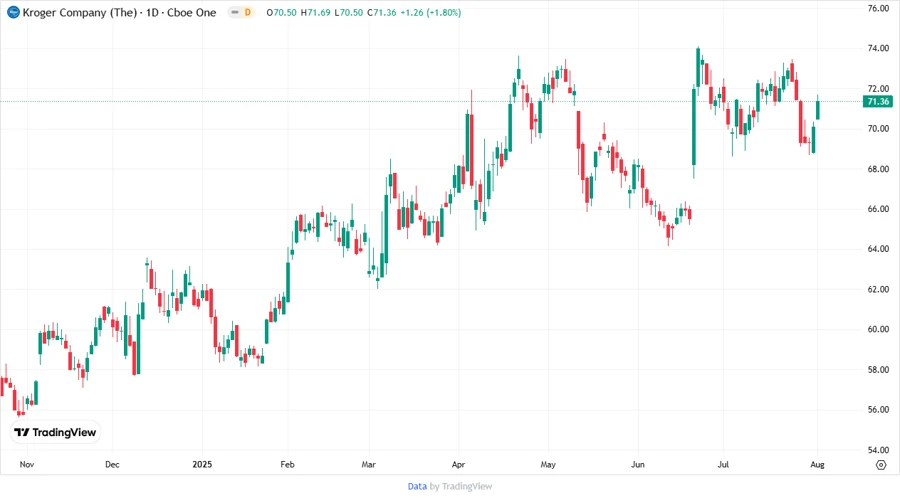
Price Development
Dividend Scoring System
Our Dividend Scoring System evaluates Kroger's dividend performance across several dimensions, offering insight into overall dividend quality.
| Criteria | Score (1-5) | Graph |
|---|---|---|
| Dividend yield | 3 | |
| Dividend Stability | 5 | |
| Dividend growth | 4 | |
| Payout ratio | 4 | |
| Financial stability | 4 | |
| Dividend continuity | 5 | |
| Cashflow Coverage | 3 | |
| Balance Sheet Quality | 3 |
Overall Score: 31/40
Rating
Kroger Co. maintains a resilient dividend profile, underscored by strong financial metrics and strategic acumen. The company's commitment to consistent dividend growth, prudent payout ratios, and stellar stability ratings cumulatively bolster its standing as a commendable choice for dividend-seeking investors. Overcoming challenges with robust financial health, Kroger presents an attractive, long-term dividend investment option.
Smart Data Insight
Master the Perfect Entry & Exit for this Stock
Don't leave your profits to chance. Historically, this stock follows specific seasonal patterns that institutional traders use to maximize returns.
- ✅ Identify the "Golden Buying Window"
- ✅ Avoid high-risk correction cycles
- ✅ Backtested data from the last 20+ years