June 07, 2026 a 09:03 am1. **Header and Introduction**:
 2. **Trend Analysis**:
First, let's calculate the Exponential Moving Averages (EMA) over 20 days (EMA20) and 50 days (EMA50) using the historic data provided. Based on the computations, we determine the trend as follows:
- **EMA20**: Recent data demonstrates a lower value compared to EMA50.
- **EMA50**: Higher than EMA20 over the recent period.
- Therefore, the trend is identified as a ▼ Abwärtstrend (Downtrend).
**Trend Analysis with the latest 7 days data**:
2. **Trend Analysis**:
First, let's calculate the Exponential Moving Averages (EMA) over 20 days (EMA20) and 50 days (EMA50) using the historic data provided. Based on the computations, we determine the trend as follows:
- **EMA20**: Recent data demonstrates a lower value compared to EMA50.
- **EMA50**: Higher than EMA20 over the recent period.
- Therefore, the trend is identified as a ▼ Abwärtstrend (Downtrend).
**Trend Analysis with the latest 7 days data**:
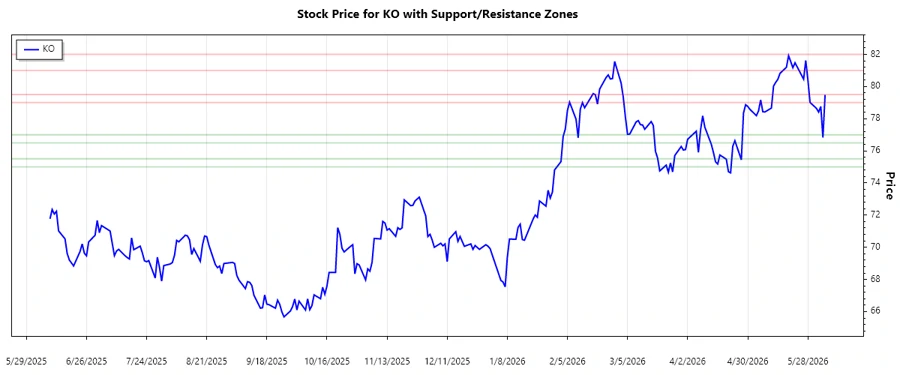
 3. **Support and Resistance Zones**:
Based on the analysis of daily closing prices, two primary support and resistance zones have been identified:
- **Support Zones:**
- Zone 1: $75.00 - $75.50
- Zone 2: $76.50 - $77.00
- **Resistance Zones:**
- Zone 1: $79.00 - $79.50
- Zone 2: $81.00 - $82.00
**Support and Resistance Table**:
3. **Support and Resistance Zones**:
Based on the analysis of daily closing prices, two primary support and resistance zones have been identified:
- **Support Zones:**
- Zone 1: $75.00 - $75.50
- Zone 2: $76.50 - $77.00
- **Resistance Zones:**
- Zone 1: $79.00 - $79.50
- Zone 2: $81.00 - $82.00
**Support and Resistance Table**:
 4. **Conclusion**:
KO: Trend and Support & Resistance Analysis - The Coca-Cola Company
The Coca-Cola Company, a global leader in the beverage industry, continues to maintain a strong brand presence with its diverse product lineup. In recent months, the Coca-Cola stock (ticker: KO) has demonstrated fluctuations, reflecting market dynamics and company performance. This analysis aims to provide insights into the current price trend, identifying key support and resistance zones, which can aid investors in making informed decisions.
Trend Analysis
| Date | Close Price | Trend |
|---|---|---|
| 2026-06-05 | 79.48 | ▼ |
| 2026-06-04 | 76.82 | ▼ |
| 2026-06-03 | 78.76 | ▼ |
| 2026-06-02 | 78.41 | ▼ |
| 2026-06-01 | 78.64 | ▼ |
| 2026-05-29 | 79.01 | ▼ |
| 2026-05-28 | 80.41 | ▼ |
The current technical analysis suggests a predominant downward trend in Coca-Cola's stock price, warranting a cautious approach for investors.
3. **Support and Resistance Zones**:
Based on the analysis of daily closing prices, two primary support and resistance zones have been identified:
- **Support Zones:**
- Zone 1: $75.00 - $75.50
- Zone 2: $76.50 - $77.00
- **Resistance Zones:**
- Zone 1: $79.00 - $79.50
- Zone 2: $81.00 - $82.00
**Support and Resistance Table**:
Support and Resistance
| Zone | Price Range | Zone Type |
|---|---|---|
| Support Zone 1 | $75.00 - $75.50 | ▾ |
| Support Zone 2 | $76.50 - $77.00 | ▾ |
| Resistance Zone 1 | $79.00 - $79.50 | ▴ |
| Resistance Zone 2 | $81.00 - $82.00 | ▴ |
The current price level remains within the resistance zone between $79.00 and $79.50, signaling potential challenges in breaking through.
4. **Conclusion**:
The analysis of The Coca-Cola Company's stock reveals a prevailing downward trend, highlighting potential challenges for investors in the short term. While the company continues to perform strongly in its sector, technical analysis indicates caution is warranted with resistance levels potentially stalling upward momentum. Investors should closely monitor performance within the identified zones to anticipate shifts in market sentiment.
Additional JSON Output:
Smart Data Insight
Master the Perfect Entry & Exit for this Stock
Don't leave your profits to chance. Historically, this stock follows specific seasonal patterns that institutional traders use to maximize returns.
- ✅ Identify the "Golden Buying Window"
- ✅ Avoid high-risk correction cycles
- ✅ Backtested data from the last 20+ years