June 25, 2025 a 01:15 pm
KO: Trend and Support & Resistance Analysis - The Coca-Cola Company
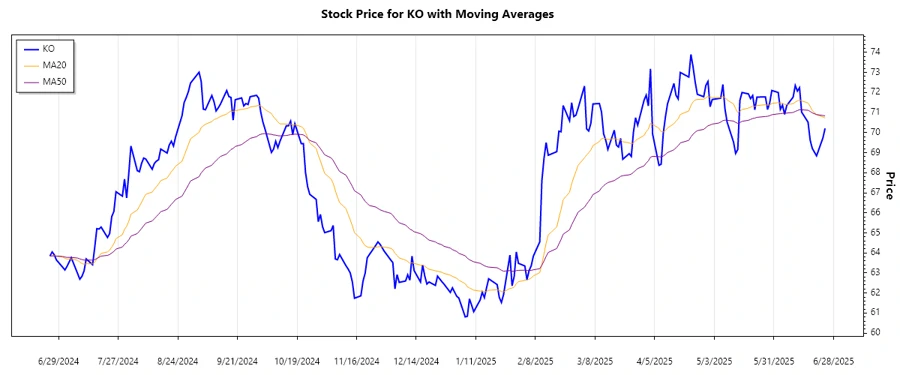
The Coca-Cola Company (KO) has shown notable resilience in its stock performance over the recent months. An analysis of the moving averages suggests a significant trend, providing insights into the short-term and long-term momentum of the stock. Given its strong global presence and brand recognition, KO stands as a popular choice among investors seeking stability in the beverage sector. With various product lines worldwide, Coca-Cola continues to leverage its diversified portfolio to maintain market share. Recent market volatility, however, could pose potential challenges in sustaining upward momentum.
Trend Analysis
| Date | Closing Price | Trend |
|---|---|---|
| 2025-06-24 | 70.21 | ▼ |
| 2025-06-23 | 69.74 | ▼ |
| 2025-06-20 | 68.84 | ▼ |
| 2025-06-18 | 69.21 | ▼ |
| 2025-06-17 | 69.62 | ▼ |
| 2025-06-16 | 70.52 | ▲ |
| 2025-06-13 | 71.02 | ▲ |
The EMA20 remains below the EMA50, signifying a persistent bearish trend. Investors might be cautious as the stock navigates through this declining phase, potentially looking for reversal patterns or support levels.
Support- and Resistance
| Zone Type | From | To |
|---|---|---|
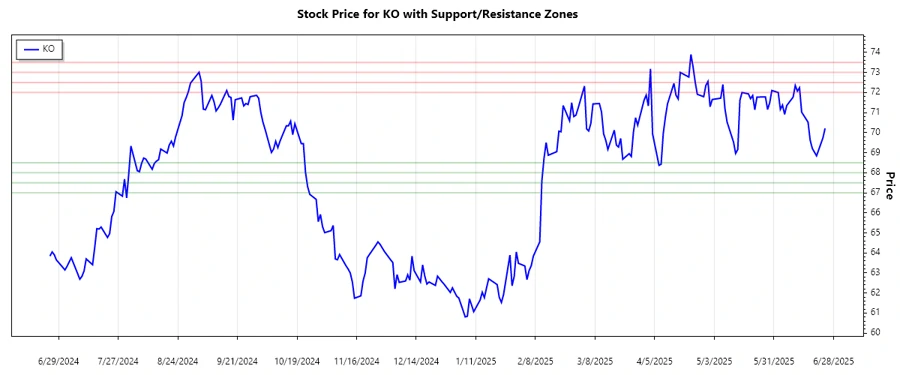
| Support Zone 1 | 68.00 | 68.50 |
| Support Zone 2 | 67.00 | 67.50 |
| Resistance Zone 1 | 72.00 | 72.50 |
| Resistance Zone 2 | 73.00 | 73.50 |
The current price is approaching the lower end of the established resistance zone, suggesting potential headwinds ahead. If the stock breaks this level, it could lead to fresh buying interest.
Conclusion
The technical analysis of The Coca-Cola Company (KO) reveals a prevailing bearish momentum with the stock trading below critical moving averages. Although the company enjoys a robust market presence, current market dynamics and resistance levels may challenge upward movements. Nonetheless, support levels offer potential entry points for value investors. Analysts should monitor market catalysts that could trigger a reversal, such as changes in consumer preferences or major corporate announcements. Overall, understanding the trend and key zones can aid in strategic investment decisions.
Smart Data Insight
Master the Perfect Entry & Exit for this Stock
Don't leave your profits to chance. Historically, this stock follows specific seasonal patterns that institutional traders use to maximize returns.
- ✅ Identify the "Golden Buying Window"
- ✅ Avoid high-risk correction cycles
- ✅ Backtested data from the last 20+ years