June 22, 2026 a 10:15 am

KO: Fibonacci Analysis - The Coca-Cola Company
The Coca-Cola Company's stock has shown signs of recent volatility, characteristic of broader market movements. Following a steady upward momentum, the stock saw a peak in June 2026, suggesting a strong market position. Investors might find the current retracement levels an enticing entry point, potentially indicating forthcoming resistance if the stock maintains this trajectory.
Fibonacci Analysis
| Start Date | End Date | High Price | High Date | Low Price | Low Date |
|---|---|---|---|---|---|
| 2025-12-31 | 2026-06-12 | 83.59 | 2026-06-10 | 67.54 | 2026-01-07 |
| Retracement Level | Price Level |
|---|---|
| 0.236 | 79.38 |
| 0.382 | 76.88 |
| 0.5 | 75.56 |
| 0.618 | 74.25 |
| 0.786 | 72.26 |
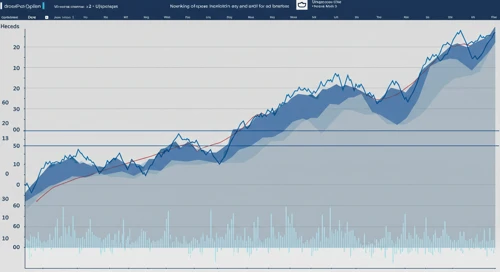
Currently, the Coca-Cola Company's stock is within the 0.236 Fibonacci retracement level. This zone suggests a potential resistance level in the near term, where higher volatility might occur as the stock might retrace to test lower support levels.
Figure: KO Stock Price Chart with Fibonacci Levels
Conclusion
The Coca-Cola Company's robust portfolio and extensive global reach provide stability and growth potential. Despite current retracement, the stock's upward trend signals fundamental strength. Investors should be cautious of potential resistance, yet optimistic due to favorable market conditions. Technical indicators suggest strategic entry points for long-term gains, albeit with the need to monitor economic shifts and market sentiment.
Smart Data Insight
Master the Perfect Entry & Exit for this Stock
Don't leave your profits to chance. Historically, this stock follows specific seasonal patterns that institutional traders use to maximize returns.
- ✅ Identify the "Golden Buying Window"
- ✅ Avoid high-risk correction cycles
- ✅ Backtested data from the last 20+ years