April 28, 2026 a 03:31 pm

KO: Dividend Analysis - The Coca-Cola Company
As an iconic player in the beverage industry, The Coca-Cola Company boasts a robust dividend profile, underpinned by a 57-year history of consistent payouts. With a dividend yield of 2.66%, this time-tested giant exemplifies stability and reliability for income-focused investors. Despite its hefty size, Coca-Cola has demonstrated moderate but steady dividend growth over the past half-decade, cementing its status as a solid choice in the realm of blue-chip dividend stocks.
📊 Overview
The Coca-Cola Company operates within the Consumer Staples sector, focusing primarily on beverage products. As of now, it provides a dividend yield of 2.66% with a current dividend per share of $2.04 USD. The substantial 57-year dividend history marks an enduring commitment to shareholder returns with no recent cuts or suspensions.
| Data Point | Value |
|---|---|
| Sector | Consumer Staples |
| Dividend Yield | 2.66 % |
| Current Dividend per Share | $2.04 USD |
| Dividend History | 57 years |
| Last Cut or Suspension | None |
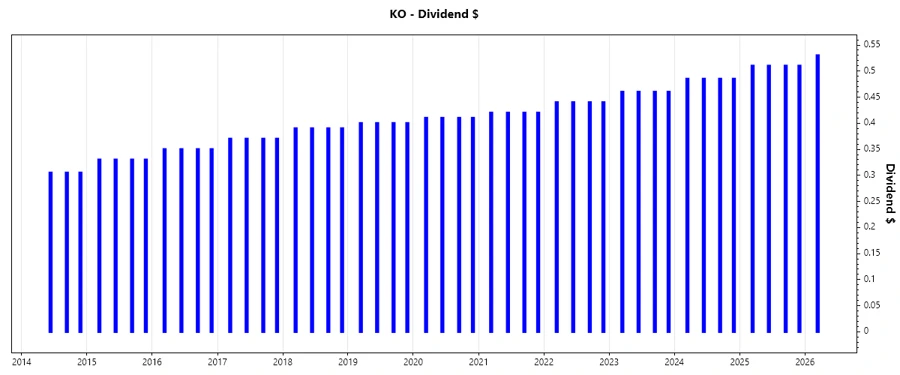
🗣️ Dividend History
Dividend history is a critical metric for assessing a company's financial health and its commitment to rewarding shareholders. Coca-Cola has a noteworthy 57-year streak of increasing dividends, which signifies management's confidence in their cash flow model. Such consistency greatly appeals to long-term, income-seeking investors.
| Year | Dividend per Share (USD) |
|---|---|
| 2026 | 0.53 |
| 2025 | 2.04 |
| 2024 | 1.94 |
| 2023 | 1.84 |
| 2022 | 1.76 |
📈 Dividend Growth
Dividend growth is a fundamental indicator of a company's profitability and financial stability. Coca-Cola reports an impressive dividend growth rate of 5.04% over three years and 4.46% over five years, reflecting prudent financial management and promising future prospects for dividend increases.
| Time | Growth |
|---|---|
| 3 years | 5.04 % |
| 5 years | 4.46 % |
The average dividend growth is 4.46 % over 5 years. This shows moderate but steady dividend growth.
⚠️ Payout Ratio
Payout ratios provide insight into a company's financial strategy regarding dividends. With an EPS-based payout ratio of 64.06% and a Free Cash Flow (FCF) based payout ratio of 69.90%, Coca-Cola remains in a sound position to sustain its dividend payouts without jeopardizing financial flexibility or business operations.
| Key Figure | Ratio |
|---|---|
| EPS-based | 64.06 % |
| Free Cash Flow-based | 69.90 % |
💰 Cashflow & Capital Efficiency
The cash flow analysis indicates how efficiently Coca-Cola generates free cash flow in comparison to its earnings and capital. Over recent years, we see robust earnings and CAPEX management which serves to maintain adequate liquidity for ongoing operations and dividend payments.
| Indicator | 2023 | 2024 | 2025 |
|---|---|---|---|
| Free Cash Flow Yield | 3.83 % | 1.77 % | 1.76 % |
| Earnings Yield | 4.21 % | 3.96 % | 4.36 % |
| CAPEX to Operating Cash Flow | 15.97 % | 30.31 % | 28.51 % |
| Stock-based Compensation to Revenue | 0.55 % | 0.61 % | 0.58 % |
| Free Cash Flow/Operating Cash Flow Ratio | 71.49 % | 69.67 % | 71.49 % |
These figures suggest Coca-Cola effectively balances capital allocations, optimizing for both operational efficiency and investor returns.
📉 Balance Sheet & Leverage Analysis
Coca-Cola's balance sheet metrics suggest moderate leverage, balanced with strategic debt management to ensure liquidity and financial stability. The company effectively manages its debt in relation to equity, assets, and overall capital.
| Ratio | 2023 | 2024 | 2025 |
|---|---|---|---|
| Debt-to-Equity | 1.67 | 1.84 | 1.41 |
| Debt-to-Assets | 0.44 | 0.45 | 0.43 |
| Debt-to-Capital | 0.63 | 0.65 | 0.59 |
| Net Debt to EBITDA | 2.18 | 2.21 | 1.88 |
| Current Ratio | 1.13 | 1.03 | 1.46 |
| Quick Ratio | 0.95 | 0.84 | 1.25 |
| Financial Leverage | 3.77 | 4.05 | 3.26 |
Even with substantial leverage, Coca-Cola remains financially agile. The stable current and quick ratios further affirm its operational resilience.
✅ Fundamental Strength & Profitability
With outstanding profitability ratios, Coca-Cola secures its standing among elite companies globally. High margins reflect its competitiveness and capability to generate returns.
| Indicator | 2023 | 2024 | 2025 |
|---|---|---|---|
| Return on Equity | 41.30 % | 42.77 % | 40.74 % |
| Return on Assets | 10.97 % | 10.57 % | 12.50 % |
| Margins: Net | 23.42 % | 22.59 % | 27.34 % |
| EBIT Margin | 31.65 % | 31.33 % | 36.82 % |
| EBITDA Margin | 34.11 % | 33.61 % | 39.01 % |
| Gross Margin | 59.52 % | 61.06 % | 61.63 % |
| R&D to Revenue | 0 % | 0 % | 0 % |
Profitability remains a key strength for Coca-Cola, affording it continued growth and revenue generation potential.
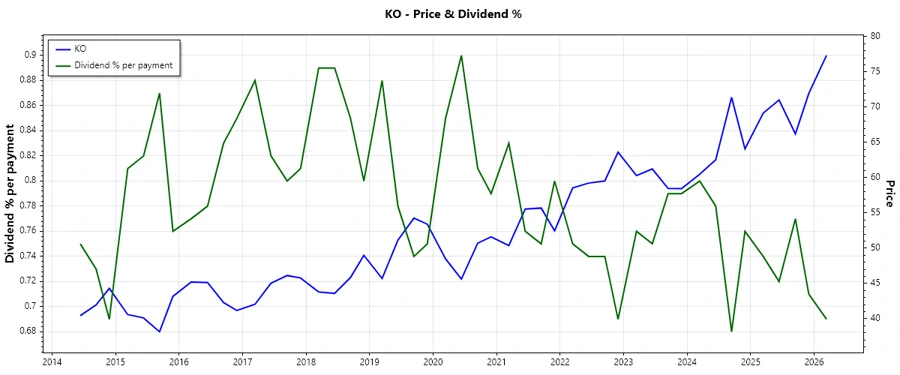
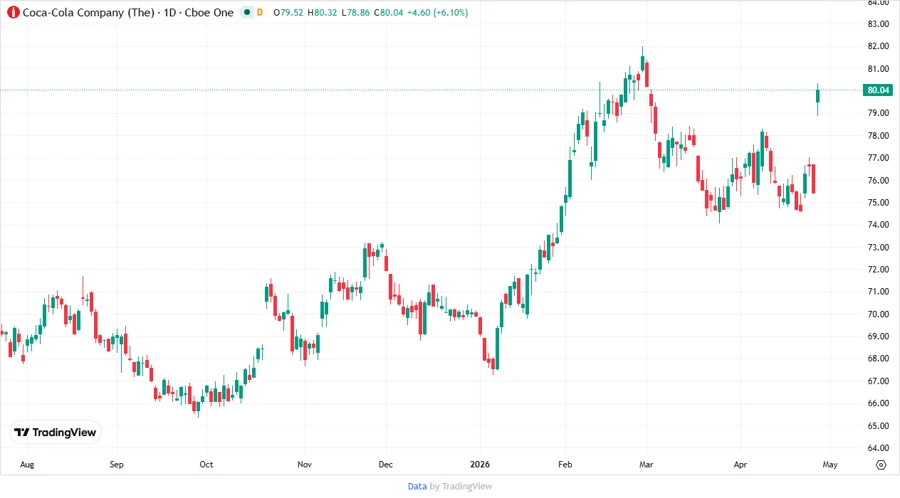
📊 Price Development
🌟 Dividend Scoring System
| Category | Score | |
|---|---|---|
| Dividend Yield | 4 | |
| Dividend Stability | 5 | |
| Dividend Growth | 4 | |
| Payout Ratio | 3 | |
| Financial Stability | 4 | |
| Dividend Continuity | 5 | |
| Cashflow Coverage | 4 | |
| Balance Sheet Quality | 3 |
Total Score: 32/40
🔍 Rating
The Coca-Cola Company is a prime candidate for dividend investors seeking steady income with moderate growth potential. Its long history of dividends, strong profitability, and robust financial metrics make it a reliable option within the Consumer Staples sector. Rating: BUY